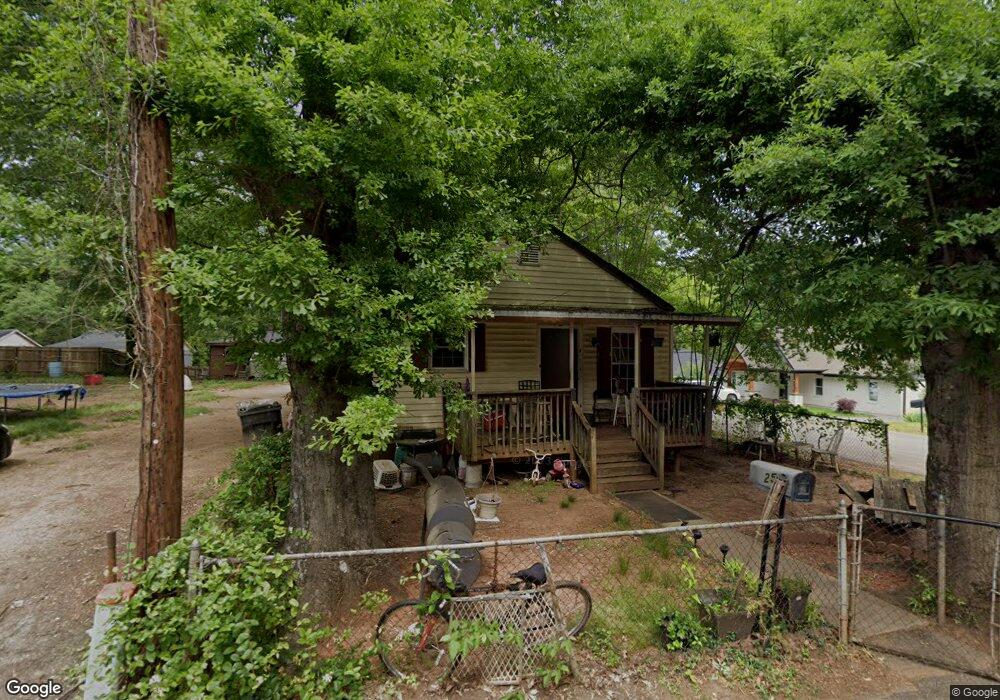
25 Maple St Greenville, SC 29609
North Greenville NeighborhoodEstimated Value: $91,000 - $138,000
2
Beds
1
Bath
690
Sq Ft
$170/Sq Ft
Est. Value
About This Home
This home is located at 25 Maple St, Greenville, SC 29609 and is currently estimated at $117,469, approximately $170 per square foot. 25 Maple St is a home located in Greenville County with nearby schools including Summit Drive Elementary School, League Academy, and Berea High School.
Ownership History
Date
Name
Owned For
Owner Type
Purchase Details
Closed on
Mar 27, 2020
Sold by
Maxwell Donald J and Maxwell Florilla Annette
Bought by
Mmc Home Solutions Llc
Current Estimated Value
Purchase Details
Closed on
Mar 25, 2020
Sold by
Mmc Home Solutions Llc
Bought by
Fifty Portfolio Llc
Purchase Details
Closed on
Oct 15, 2016
Sold by
Jackson Jennifer
Bought by
Maxwell Donald J and Maxwell Florilla Annette
Purchase Details
Closed on
Feb 18, 2003
Sold by
Maxwell Florilla B
Bought by
Jackson Jennifer Trustee
Create a Home Valuation Report for This Property
The Home Valuation Report is an in-depth analysis detailing your home's value as well as a comparison with similar homes in the area
Home Values in the Area
Average Home Value in this Area
Purchase History
| Date | Buyer | Sale Price | Title Company |
|---|---|---|---|
| Mmc Home Solutions Llc | $10,000 | None Available | |
| Fifty Portfolio Llc | $38,000 | None Available | |
| Maxwell Donald J | -- | None Available | |
| Jackson Jennifer Trustee | -- | -- |
Source: Public Records
Tax History Compared to Growth
Tax History
| Year | Tax Paid | Tax Assessment Tax Assessment Total Assessment is a certain percentage of the fair market value that is determined by local assessors to be the total taxable value of land and additions on the property. | Land | Improvement |
|---|---|---|---|---|
| 2024 | $1,103 | $2,220 | $360 | $1,860 |
| 2023 | $1,103 | $2,220 | $360 | $1,860 |
| 2022 | $1,067 | $2,220 | $360 | $1,860 |
| 2021 | $1,177 | $2,220 | $360 | $1,860 |
| 2020 | $1,070 | $1,800 | $360 | $1,440 |
| 2019 | $1,057 | $1,800 | $360 | $1,440 |
| 2018 | $939 | $1,800 | $360 | $1,440 |
| 2017 | $930 | $1,800 | $360 | $1,440 |
| 2016 | $839 | $28,120 | $5,140 | $22,980 |
| 2015 | $839 | $28,120 | $5,140 | $22,980 |
| 2014 | $757 | $24,471 | $4,472 | $19,999 |
Source: Public Records
Map
Nearby Homes