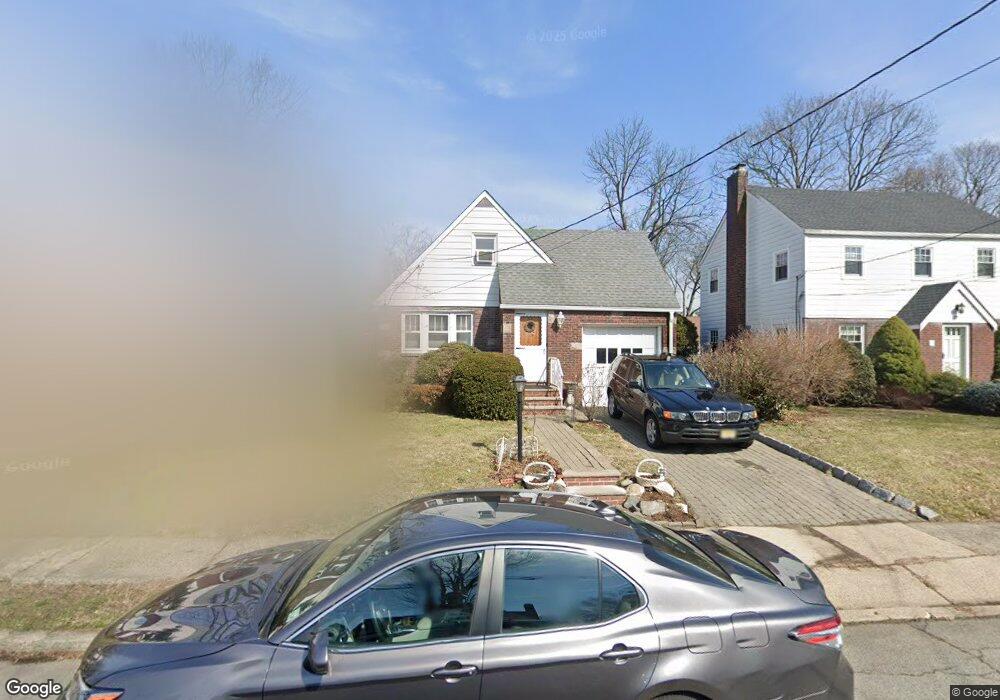
25 Maple St Teaneck, NJ 07666
Estimated Value: $584,695 - $753,000
Studio
--
Bath
1,645
Sq Ft
$406/Sq Ft
Est. Value
About This Home
This home is located at 25 Maple St, Teaneck, NJ 07666 and is currently estimated at $667,174, approximately $405 per square foot. 25 Maple St is a home located in Bergen County with nearby schools including Teaneck Senior High School, Academy of Greatness & Excellence, and Bogota Middle School.
Ownership History
Date
Name
Owned For
Owner Type
Purchase Details
Closed on
Sep 20, 2000
Bought by
Johnson Greata
Current Estimated Value
Home Financials for this Owner
Home Financials are based on the most recent Mortgage that was taken out on this home.
Original Mortgage
$88,000
Outstanding Balance
$31,846
Interest Rate
8%
Estimated Equity
$635,328
Purchase Details
Closed on
Jul 14, 1995
Sold by
Estate Of Blanche Gawronski
Bought by
Johnson Greata
Home Financials for this Owner
Home Financials are based on the most recent Mortgage that was taken out on this home.
Original Mortgage
$140,000
Interest Rate
7.56%
Create a Home Valuation Report for This Property
The Home Valuation Report is an in-depth analysis detailing your home's value as well as a comparison with similar homes in the area
Home Values in the Area
Average Home Value in this Area
Purchase History
| Date | Buyer | Sale Price | Title Company |
|---|---|---|---|
| Johnson Greata | -- | -- | |
| Johnson Greata | -- | -- | |
| Johnson Greata | $160,000 | -- |
Source: Public Records
Mortgage History
| Date | Status | Borrower | Loan Amount |
|---|---|---|---|
| Open | Johnson Greata | $88,000 | |
| Closed | Johnson Greata | $88,000 | |
| Previous Owner | Johnson Greata | $140,000 |
Source: Public Records
Tax History
| Year | Tax Paid | Tax Assessment Tax Assessment Total Assessment is a certain percentage of the fair market value that is determined by local assessors to be the total taxable value of land and additions on the property. | Land | Improvement |
|---|---|---|---|---|
| 2025 | $10,381 | $475,300 | $265,000 | $210,300 |
| 2024 | $10,854 | $475,300 | $265,000 | $210,300 |
| 2023 | $10,640 | $328,700 | $172,500 | $156,200 |
| 2022 | $10,640 | $328,700 | $172,500 | $156,200 |
| 2021 | $10,702 | $328,700 | $172,500 | $156,200 |
| 2020 | $10,630 | $328,700 | $172,500 | $156,200 |
| 2019 | $10,509 | $328,700 | $172,500 | $156,200 |
| 2018 | $10,430 | $328,700 | $172,500 | $156,200 |
| 2017 | $10,331 | $328,700 | $172,500 | $156,200 |
| 2016 | $10,177 | $328,700 | $172,500 | $156,200 |
| 2015 | $10,015 | $328,700 | $172,500 | $156,200 |
| 2014 | $10,575 | $411,300 | $220,000 | $191,300 |
Source: Public Records
Map
Nearby Homes
- 20 Maple St
- 111 Teaneck Rd
- 44 Jasper Ave
- 57 Park Ave
- 238 Park Ave
- 159 Sherwood Ave
- 196 Fort Lee Rd
- 203 Queen Anne Rd
- 365 Rockledge Place
- 203 Queen Anne Rd
- 227 Beechwood Ave
- 133 Degraw Ave
- 71 Gordon St
- 82 Hazelton St
- 290 Queen Anne Rd
- 50 Grand Ave
- 182 Hillside Ave
- 93 Copley Ave
- 300 Crestview Place
- 114 Hackensack Ave
Your Personal Tour Guide
Ask me questions while you tour the home.