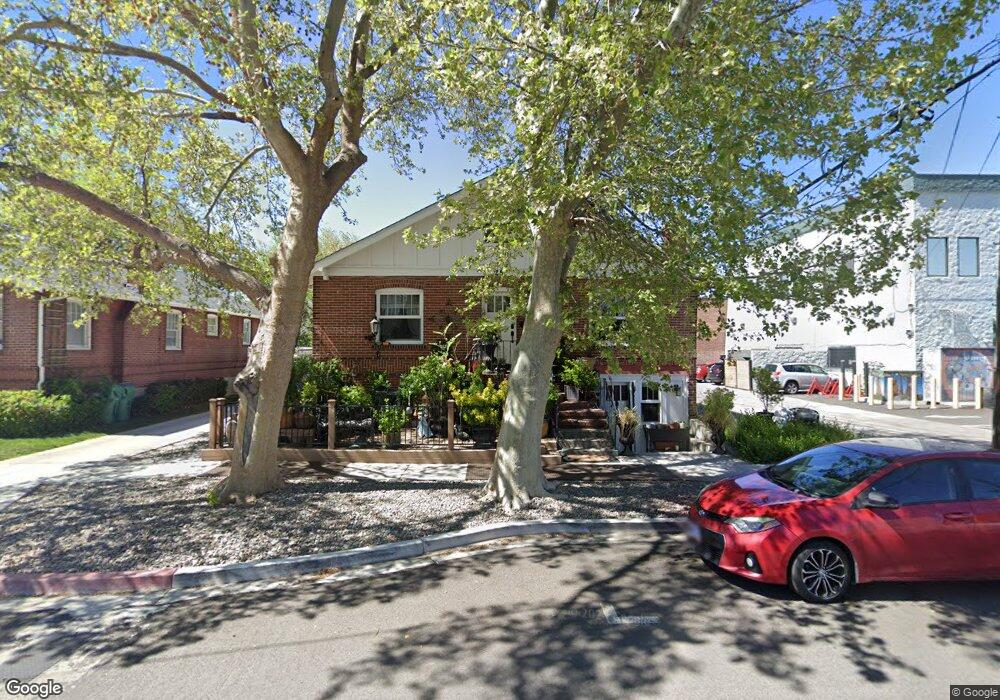
25 Martin St Reno, NV 89509
MidTown NeighborhoodEstimated Value: $607,706 - $799,000
2
Beds
2
Baths
1,104
Sq Ft
$629/Sq Ft
Est. Value
About This Home
This home is located at 25 Martin St, Reno, NV 89509 and is currently estimated at $694,927, approximately $629 per square foot. 25 Martin St is a home located in Washoe County with nearby schools including Mount Rose K-8 School of Languages, Darrell C Swope Middle School, and Reno High School.
Ownership History
Date
Name
Owned For
Owner Type
Purchase Details
Closed on
Jan 15, 2019
Sold by
Beach Curtis and Beach Sabine
Bought by
C & S Beach Properties Llc
Current Estimated Value
Purchase Details
Closed on
Dec 20, 2011
Sold by
Brady Donald B and Brady Patricia
Bought by
Beach Curtis and Beach Sabine
Purchase Details
Closed on
Sep 23, 2011
Sold by
Wood Griffin N and Wood Brande A
Bought by
Brady Donald B and Brady Patricia
Purchase Details
Closed on
Feb 15, 2006
Sold by
Western Energy Ltd
Bought by
Wood Griffin N and Wood Brande A
Home Financials for this Owner
Home Financials are based on the most recent Mortgage that was taken out on this home.
Original Mortgage
$865,000
Interest Rate
6.15%
Mortgage Type
Construction
Purchase Details
Closed on
Oct 10, 1997
Sold by
Snyder Stanley and Snyder Candace E
Bought by
Western Energy Ltd
Create a Home Valuation Report for This Property
The Home Valuation Report is an in-depth analysis detailing your home's value as well as a comparison with similar homes in the area
Home Values in the Area
Average Home Value in this Area
Purchase History
| Date | Buyer | Sale Price | Title Company |
|---|---|---|---|
| C & S Beach Properties Llc | -- | None Available | |
| Beach Curtis | $76,000 | Ticor Title Reno Lakeside | |
| Brady Donald B | $139,000 | First Centennial Reno | |
| Wood Griffin N | $1,250,000 | First Centennial Title Co | |
| Western Energy Ltd | $760,000 | Western Title Company Inc |
Source: Public Records
Mortgage History
| Date | Status | Borrower | Loan Amount |
|---|---|---|---|
| Previous Owner | Wood Griffin N | $865,000 |
Source: Public Records
Tax History
| Year | Tax Paid | Tax Assessment Tax Assessment Total Assessment is a certain percentage of the fair market value that is determined by local assessors to be the total taxable value of land and additions on the property. | Land | Improvement |
|---|---|---|---|---|
| 2026 | $1,261 | $88,005 | $65,625 | $22,380 |
| 2025 | $1,562 | $87,879 | $65,625 | $22,254 |
| 2024 | $1,562 | $88,103 | $65,625 | $22,478 |
| 2023 | $1,446 | $85,643 | $65,625 | $20,018 |
| 2022 | $1,340 | $66,524 | $50,155 | $16,369 |
| 2021 | $1,245 | $54,748 | $39,130 | $15,618 |
| 2020 | $1,171 | $50,610 | $35,000 | $15,610 |
| 2019 | $1,116 | $48,407 | $33,390 | $15,017 |
| 2018 | $1,065 | $39,632 | $25,200 | $14,432 |
| 2017 | $1,028 | $38,872 | $24,500 | $14,372 |
| 2016 | $1,000 | $41,196 | $26,250 | $14,946 |
| 2015 | $488 | $30,074 | $16,100 | $13,974 |
| 2014 | $937 | $27,923 | $14,700 | $13,223 |
| 2013 | -- | $24,572 | $11,900 | $12,672 |
Source: Public Records
Map
Nearby Homes
- 880 S Center St
- 800 S Center St
- 60 Caliente St
- 243 Claremont St
- 943 S Wells Ave
- 1001 Lander St
- 400 Claremont St
- 536 Sinclair St
- 343 & 347 Mount Rose St St
- 343 Mount Rose St
- 512 Humboldt St
- 446 Roberts St
- 453 Cheney St
- 459 Cheney St
- 330 Stewart St
- 1339 Locust St
- 1418 Lander St
- 1301 Wright St
- 755 Balzar Cir
- 590 Saint Lawrence Ave
- 35 Martin St
- 950 Haskell St
- 952 Haskell St
- 955 S Virginia St
- 000 Martin St
- 924 Haskell St Unit 3
- 924 Haskell St
- 941 S Virginia St Unit 27
- 941 S Virginia St
- 922 Haskell St
- 36 Martin St
- 30 Martin St
- 30 Martin St Unit D
- 46 Martin St
- 40 La Rue Ave
- 103 Martin St
- 121 Martin St
- 901 S Virginia St
- 927 Haskell St
- 127 Martin St
Your Personal Tour Guide
Ask me questions while you tour the home.