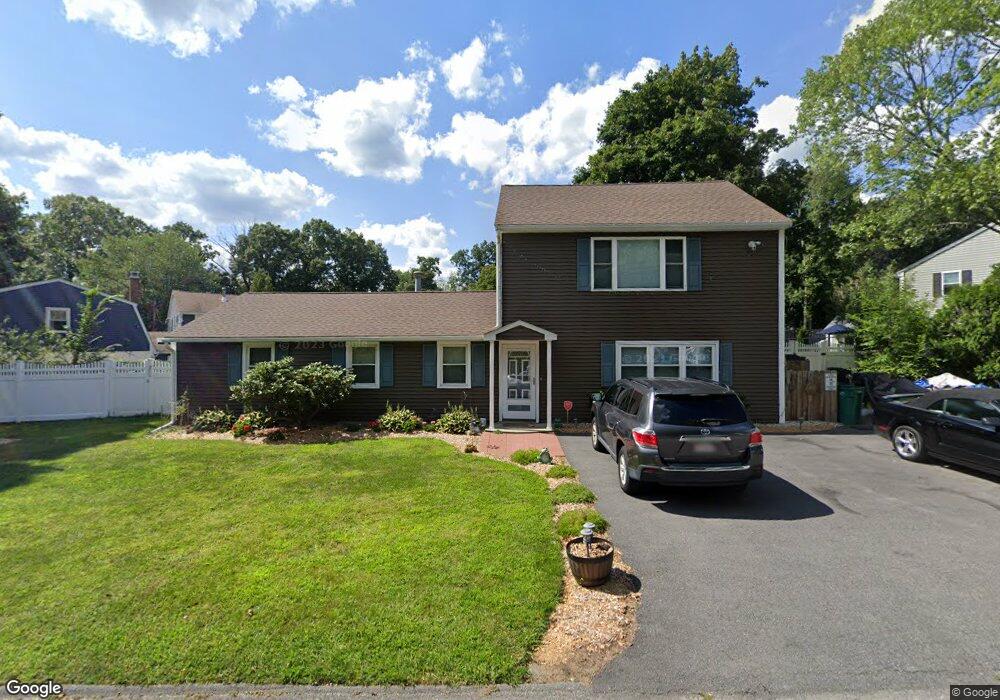
25 Matthew Rd Billerica, MA 01821
Estimated Value: $589,000 - $679,000
3
Beds
1
Bath
1,400
Sq Ft
$457/Sq Ft
Est. Value
About This Home
This home is located at 25 Matthew Rd, Billerica, MA 01821 and is currently estimated at $640,242, approximately $457 per square foot. 25 Matthew Rd is a home located in Middlesex County with nearby schools including Billerica Memorial High School.
Ownership History
Date
Name
Owned For
Owner Type
Purchase Details
Closed on
May 15, 2019
Sold by
Dicicco Nanci J
Bought by
Carroll Nanci J
Current Estimated Value
Home Financials for this Owner
Home Financials are based on the most recent Mortgage that was taken out on this home.
Original Mortgage
$289,500
Outstanding Balance
$251,339
Interest Rate
4.1%
Mortgage Type
New Conventional
Estimated Equity
$388,903
Purchase Details
Closed on
Oct 10, 2014
Sold by
Dicicco Michael J and Dicicco Nanci J
Bought by
Dicicco Nanci J
Purchase Details
Closed on
Aug 22, 2006
Sold by
Amato Mary C
Bought by
Dicicco Michael J and Dicicco Nanci J
Home Financials for this Owner
Home Financials are based on the most recent Mortgage that was taken out on this home.
Original Mortgage
$265,500
Interest Rate
6.88%
Mortgage Type
Purchase Money Mortgage
Create a Home Valuation Report for This Property
The Home Valuation Report is an in-depth analysis detailing your home's value as well as a comparison with similar homes in the area
Purchase History
| Date | Buyer | Sale Price | Title Company |
|---|---|---|---|
| Carroll Nanci J | -- | -- | |
| Dicicco Nanci J | -- | -- | |
| Dicicco Nanci J | -- | -- | |
| Dicicco Michael J | $295,000 | -- | |
| Dicicco Michael J | $295,000 | -- |
Source: Public Records
Mortgage History
| Date | Status | Borrower | Loan Amount |
|---|---|---|---|
| Open | Carroll Nanci J | $289,500 | |
| Previous Owner | Dicicco Michael J | $265,500 | |
| Previous Owner | Dicicco Michael J | $85,000 |
Source: Public Records
Tax History
| Year | Tax Paid | Tax Assessment Tax Assessment Total Assessment is a certain percentage of the fair market value that is determined by local assessors to be the total taxable value of land and additions on the property. | Land | Improvement |
|---|---|---|---|---|
| 2025 | $5,594 | $492,000 | $281,200 | $210,800 |
| 2024 | $5,295 | $469,000 | $267,700 | $201,300 |
| 2023 | $5,485 | $462,100 | $247,400 | $214,700 |
| 2022 | $5,026 | $397,600 | $221,700 | $175,900 |
| 2021 | $5,075 | $390,400 | $217,200 | $173,200 |
| 2020 | $4,912 | $378,100 | $208,900 | $169,200 |
| 2019 | $4,168 | $309,200 | $196,000 | $113,200 |
| 2018 | $4,065 | $286,500 | $184,800 | $101,700 |
| 2017 | $3,907 | $277,300 | $184,800 | $92,500 |
| 2016 | $3,739 | $264,400 | $171,900 | $92,500 |
| 2015 | $3,712 | $264,400 | $171,900 | $92,500 |
| 2014 | $3,415 | $239,000 | $146,500 | $92,500 |
Source: Public Records
Map
Nearby Homes
- 30 Wyman Rd
- 25 Wyman Rd
- 32 Marshall St
- 3 Columbia Rd
- 24 Friendship St
- 11 Fuller Rd
- 2 Perreault Ave
- 498 Middlesex Turnpike
- 36 Webb Brook Rd Unit 3
- 7 Sunrise Ave
- 9 Pinegrove Ave
- 42 Wildcrest Ave
- 10 Kenmar Dr Unit 40
- 20 Kenmar Dr Unit 189
- 12 Horton Ln
- 27 Fox Run Rd
- 12 Ridgeway Ave
- 5 Kenmar Dr Unit 9
- 17 Glenvale Ave
- 41 Glenvale Ave
Your Personal Tour Guide
Ask me questions while you tour the home.