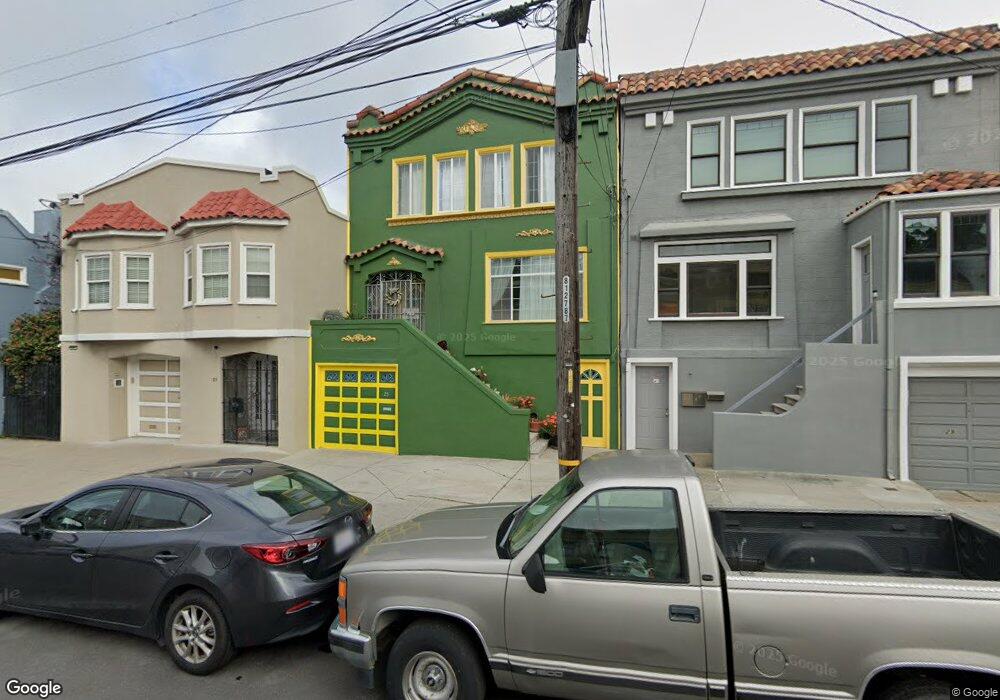
25 Maynard St San Francisco, CA 94112
Excelsior NeighborhoodEstimated Value: $1,066,000 - $1,371,000
About This Home
This home is located at 25 Maynard St, San Francisco, CA 94112 and is currently estimated at $1,272,834, approximately $707 per square foot. 25 Maynard St is a home located in San Francisco County with nearby schools including Hillcrest Elementary School, King Jr. (Martin Luther) Academic Middle School, and Cornerstone Academy-Silver Campus.
Ownership History
We collect this data history from publicly available records. To have your information removed, we recommend requesting removal directly through your county’s website.
Purchase Details
Home Financials for this Owner
Home Financials are based on the most recent Mortgage that was taken out on this home.Home Values in the Area
Average Home Value in this Area
Purchase History
We collect this data history from publicly available records. To have your information removed, we recommend requesting removal directly through your county’s website.
| Date | Buyer | Sale Price | Title Company |
|---|---|---|---|
| $150,000 | First American Title Co |
Mortgage History
We collect this data history from publicly available records. To have your information removed, we recommend requesting removal directly through your county’s website.
| Date | Status | Borrower | Loan Amount |
|---|---|---|---|
| Open | $150,000 |
Tax History
We collect this data history from publicly available records. To have your information removed, we recommend requesting removal directly through your county’s website.
| Year | Tax Paid | Tax Assessment Tax Assessment Total Assessment is a certain percentage of the fair market value that is determined by local assessors to be the total taxable value of land and additions on the property. | Land | Improvement |
|---|---|---|---|---|
| 2025 | $3,408 | $235,135 | $78,374 | $156,761 |
| 2024 | $3,408 | $230,526 | $76,838 | $153,688 |
| 2023 | $3,345 | $226,007 | $75,332 | $150,675 |
| 2022 | $3,264 | $221,576 | $73,855 | $147,721 |
| 2021 | $3,200 | $217,232 | $72,407 | $144,825 |
| 2020 | $3,233 | $215,005 | $71,665 | $143,340 |
| 2019 | $3,125 | $210,790 | $70,260 | $140,530 |
| 2018 | $3,021 | $206,658 | $68,883 | $137,775 |
| 2017 | $2,685 | $202,607 | $67,533 | $135,074 |
| 2016 | $2,612 | $198,635 | $66,209 | $132,426 |
| 2015 | $2,576 | $195,652 | $65,215 | $130,437 |
| 2014 | $2,509 | $191,820 | $63,938 | $127,882 |
Map
- 35 Admiral Ave
- 106 Madrid St
- 88 Glen Ct
- 273 Edinburgh St
- 263 Naples St
- 35 Wilder St
- 53 Wilder St Unit 403
- 19 Joost Ave
- 23 Brompton Ave
- 160 Santa Rosa Ave
- 401 Arlington St Unit 405
- 4592-4594 Mission St
- 548 Laidley St
- 23 Stoneyford Ave
- 1749 San Jose Ave
- 37 Sussex St
- 8 Mateo St
- 150 Cambridge St
- 101 Moffitt St
- 411 Vienna St
Ask me questions while you tour the home.