
Landlord's Agent in 2016
Lynn Schreiner
Realty Executives
(508) 789-4510
1 in this area
14 Total Sales
Estimated Value: $675,274 - $701,000
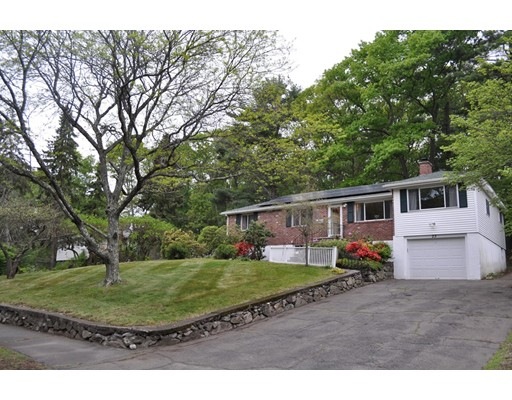
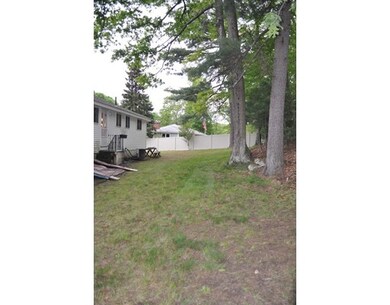
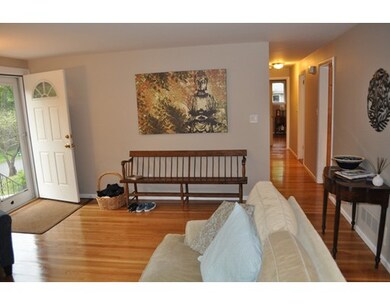
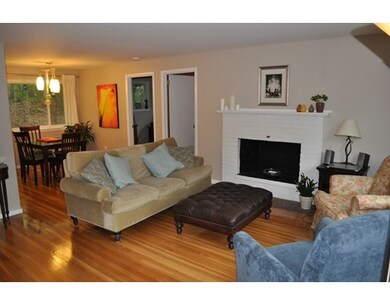
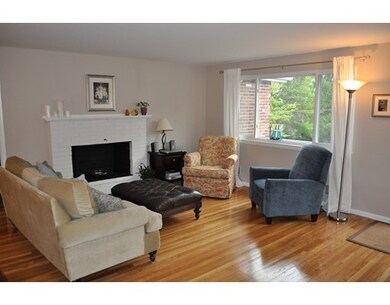
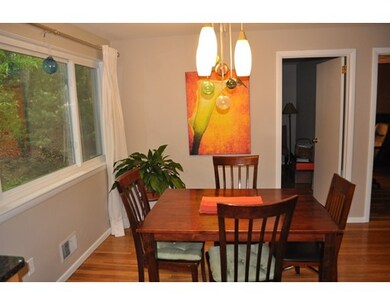
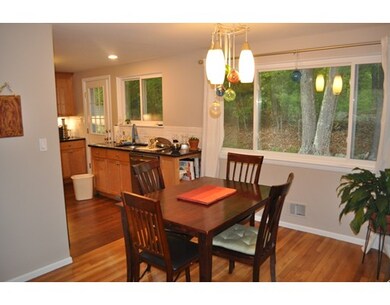
Great North Framingham neighborhood! Available July 1 (maybe a bit earlier). This home underwent a complete renovation in 2013 and offers a modern kitchen w/ upgraded appliances, newer windows, large living room with fireplace, family room, home office, plenty of storage in basement plus a semi-finished room perfect for playroom, gym, craft room, pool table etc. Full bath being completely renovated before lease starts. Washer-dryer hook ups in basement. One car attached garage. Solar panels on roof save on energy costs. Heating is by gas. Central A/C. No lead paint. Tenants pay for gas, electricity, cable, water & sewer, and take care of snow removal and landscaping.Truly a great home! Owner is seeking First, Last and One Month Security Deposit. ONE small dog considered.No cats. No smoking! Applicants MUST HAVE good credit and verifiable income of minumum $80,000 to be considered. PLEASE DO NOT TRESPASS, RING DOORBELL OR DISTURB CURRENT TENANTS! Showings begin May 16th.
Home Type
Other
Est. Annual Taxes
$7,176
Year Built
1960
Lot Details
0
| Date | Buyer | Sale Price | Title Company |
|---|---|---|---|
| Clew Brian L | $262,000 | -- | |
| Clew Brian L | $262,000 | -- |
| Date | Event | Price | List to Sale | Price per Sq Ft |
|---|---|---|---|---|
| 05/24/2016 05/24/16 | Rented | $2,300 | 0.0% | -- |
| 05/17/2016 05/17/16 | Under Contract | -- | -- | -- |
| 05/11/2016 05/11/16 | For Rent | $2,300 | -- | -- |
| Year | Tax Paid | Tax Assessment Tax Assessment Total Assessment is a certain percentage of the fair market value that is determined by local assessors to be the total taxable value of land and additions on the property. | Land | Improvement |
|---|---|---|---|---|
| 2025 | $7,176 | $601,000 | $278,600 | $322,400 |
| 2024 | $6,908 | $554,400 | $248,800 | $305,600 |
| 2023 | $6,553 | $500,600 | $222,100 | $278,500 |
| 2022 | $6,219 | $452,600 | $201,500 | $251,100 |
| 2021 | $6,050 | $430,600 | $193,700 | $236,900 |
| 2020 | $6,088 | $406,400 | $176,000 | $230,400 |
| 2019 | $5,943 | $386,400 | $176,000 | $210,400 |
| 2018 | $5,846 | $358,200 | $169,400 | $188,800 |
| 2017 | $5,389 | $322,500 | $164,500 | $158,000 |
| 2016 | $5,247 | $301,900 | $164,500 | $137,400 |
| 2015 | $5,114 | $287,000 | $164,400 | $122,600 |
Landlord's Agent in 2016
Lynn Schreiner
Realty Executives
(508) 789-4510
1 in this area
14 Total Sales
Source: MLS Property Information Network (MLS PIN)
MLS Number: 72002974
APN: FRAM-000046-000012-005731
Disclaimer: Certain information contained herein is derived from information provided by parties other than Homes.com. All information provided is deemed reliable, but is not guaranteed to be accurate and should be independently verified.
![]() The property listing data and information, or the Images, set forth herein were provided to MLS Property Information Network, Inc. from third party sources, including sellers, lessors and public records, and were compiled by MLS Property Information Network, Inc. The property listing data and information, and the Images, are for the personal, non-commercial use of consumers having a good faith interest in purchasing or leasing listed properties of the type displayed to them and may not be used for any purpose other than to identify prospective properties which such consumers may have a good faith interest in purchasing or leasing. MLS Property Information Network, Inc. and its subscribers disclaim any and all representations and warranties as to the accuracy of the property listing data and information, or as to the accuracy of any of the Images, set forth herein.
The property listing data and information, or the Images, set forth herein were provided to MLS Property Information Network, Inc. from third party sources, including sellers, lessors and public records, and were compiled by MLS Property Information Network, Inc. The property listing data and information, and the Images, are for the personal, non-commercial use of consumers having a good faith interest in purchasing or leasing listed properties of the type displayed to them and may not be used for any purpose other than to identify prospective properties which such consumers may have a good faith interest in purchasing or leasing. MLS Property Information Network, Inc. and its subscribers disclaim any and all representations and warranties as to the accuracy of the property listing data and information, or as to the accuracy of any of the Images, set forth herein.