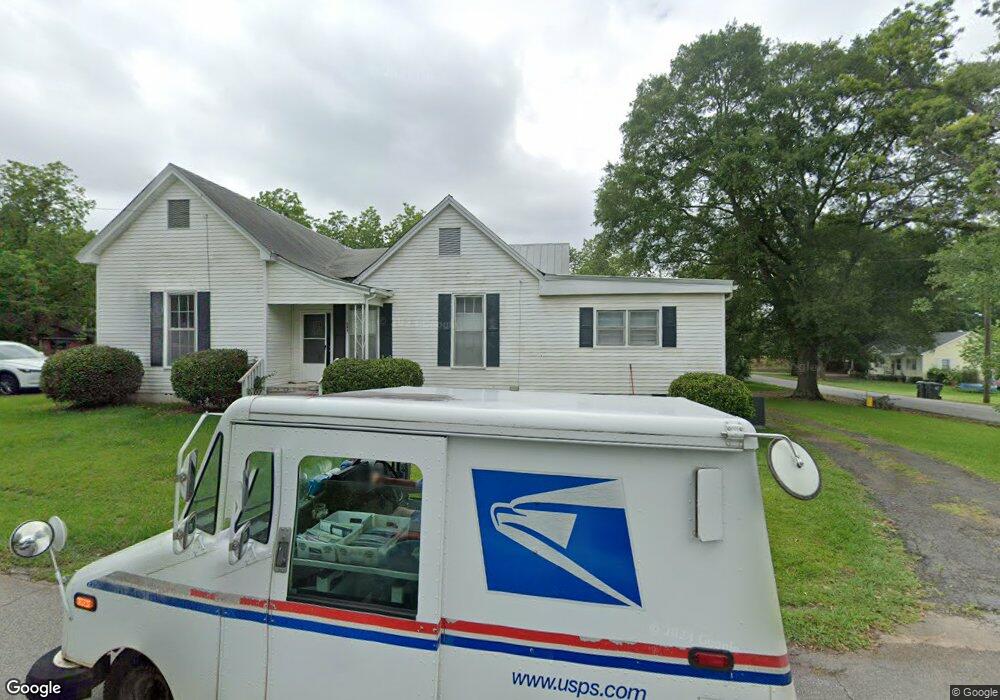
25 N Hollis St Forsyth, GA 31029
Estimated Value: $140,000 - $273,000
3
Beds
2
Baths
2,068
Sq Ft
$91/Sq Ft
Est. Value
About This Home
This home is located at 25 N Hollis St, Forsyth, GA 31029 and is currently estimated at $188,455, approximately $91 per square foot. 25 N Hollis St is a home located in Monroe County with nearby schools including T.G. Scott Elementary School, Mary Persons High School, and Lighthouse Academy.
Ownership History
Date
Name
Owned For
Owner Type
Purchase Details
Closed on
Aug 24, 2022
Sold by
B & G Rental Properties Llc
Bought by
Granitz Rental Properties Llc
Current Estimated Value
Home Financials for this Owner
Home Financials are based on the most recent Mortgage that was taken out on this home.
Original Mortgage
$106,579
Outstanding Balance
$44,216
Interest Rate
5.3%
Mortgage Type
Mortgage Modification
Estimated Equity
$144,239
Purchase Details
Closed on
Feb 14, 2020
Sold by
Patel Suryakant P
Bought by
B & G Rental Properties Llc
Purchase Details
Closed on
Oct 3, 2016
Sold by
Dhruti R
Bought by
Patel Suryakant P
Purchase Details
Closed on
Jun 24, 2009
Sold by
Two Angels Enterprises
Bought by
Patel Dhruti R
Home Financials for this Owner
Home Financials are based on the most recent Mortgage that was taken out on this home.
Original Mortgage
$70,000
Interest Rate
4.88%
Mortgage Type
Future Advance Clause Open End Mortgage
Create a Home Valuation Report for This Property
The Home Valuation Report is an in-depth analysis detailing your home's value as well as a comparison with similar homes in the area
Home Values in the Area
Average Home Value in this Area
Purchase History
| Date | Buyer | Sale Price | Title Company |
|---|---|---|---|
| Granitz Rental Properties Llc | -- | -- | |
| B & G Rental Properties Llc | -- | -- | |
| B & G Rental Properties Llc | $72,000 | -- | |
| Patel Suryakant P | $50,000 | -- | |
| Patel Dhruti R | $90,000 | -- |
Source: Public Records
Mortgage History
| Date | Status | Borrower | Loan Amount |
|---|---|---|---|
| Open | Granitz Rental Properties Llc | $106,579 | |
| Previous Owner | Patel Dhruti R | $70,000 |
Source: Public Records
Tax History Compared to Growth
Tax History
| Year | Tax Paid | Tax Assessment Tax Assessment Total Assessment is a certain percentage of the fair market value that is determined by local assessors to be the total taxable value of land and additions on the property. | Land | Improvement |
|---|---|---|---|---|
| 2024 | $1,982 | $34,080 | $3,040 | $31,040 |
| 2023 | $989 | $28,960 | $3,040 | $25,920 |
| 2022 | $856 | $28,960 | $3,040 | $25,920 |
| 2021 | $879 | $28,960 | $3,040 | $25,920 |
| 2020 | $919 | $28,960 | $3,040 | $25,920 |
| 2019 | $926 | $28,960 | $3,040 | $25,920 |
| 2018 | $928 | $28,960 | $3,040 | $25,920 |
| 2017 | $929 | $28,960 | $3,040 | $25,920 |
| 2016 | $550 | $28,960 | $3,040 | $25,920 |
| 2015 | $526 | $28,960 | $3,040 | $25,920 |
| 2014 | $524 | $28,960 | $3,040 | $25,920 |
Source: Public Records
Map
Nearby Homes
- 285 E Main St
- 0 Patrol Rd Unit 10473001
- 4580 Capulet Ct
- 2022 Highway 41 N
- 101 E Chambers St
- 205 Solomon St
- 4616 Capulet Ct
- 436 Magnolia Ct
- Cypress Plan at Juliette Crossing
- Jackson Plan at Juliette Crossing
- Cannaberra Plan at Juliette Crossing
- Oakwood Plan at Juliette Crossing
- Delilah Plan at Juliette Crossing
- Maple Plan at Juliette Crossing
- Hawthorne Plan at Juliette Crossing
- Harrison Plan at Juliette Crossing
- Camden Plan at Juliette Crossing
- Ash II Plan at Juliette Crossing
- Belmont Plan at Juliette Crossing
- Dogwood Plan at Juliette Crossing
- 15 N Hollis St
- 16 N Hollis St
- 9 N Berner Ave
- 347 E Main St
- 353 E Main St
- 37 N Berner Ave
- 24 N Hollis St
- 322 E Main St
- 351 Tift College Dr
- 34 N Hollis St
- 6 S Berner Ave
- 361 Tift College Dr
- 321 E Main St
- 21 S Berner Ave
- 10 N Forest Ave
- 410 Blount Rd
- 26 N Forest Ave
- 314 E Main St
- 26 N Forrest Ave
- 410 E Main St