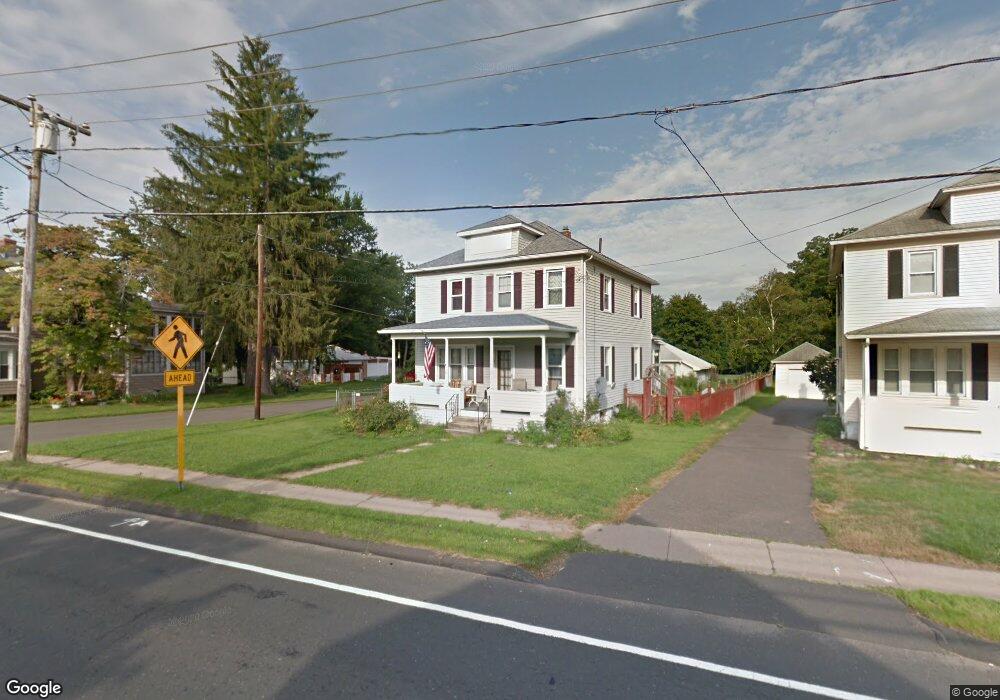
25 N Main St Windsor Locks, CT 06096
Estimated Value: $304,280 - $339,000
3
Beds
2
Baths
1,560
Sq Ft
$208/Sq Ft
Est. Value
About This Home
This home is located at 25 N Main St, Windsor Locks, CT 06096 and is currently estimated at $323,820, approximately $207 per square foot. 25 N Main St is a home located in Hartford County with nearby schools including North Street School, South Elementary School, and Windsor Locks Middle School.
Ownership History
Date
Name
Owned For
Owner Type
Purchase Details
Closed on
Sep 2, 2005
Sold by
Bourke Donald and Bourke Sharon
Bought by
Cleary Peter and Cleary Maryl
Current Estimated Value
Home Financials for this Owner
Home Financials are based on the most recent Mortgage that was taken out on this home.
Original Mortgage
$199,405
Outstanding Balance
$103,102
Interest Rate
5.81%
Estimated Equity
$220,718
Purchase Details
Closed on
Mar 14, 1988
Sold by
Slipski Edward M
Bought by
Bourke Donald E
Create a Home Valuation Report for This Property
The Home Valuation Report is an in-depth analysis detailing your home's value as well as a comparison with similar homes in the area
Home Values in the Area
Average Home Value in this Area
Purchase History
We collect this data history from publicly available records. To have your information removed, we recommend requesting removal directly through your county’s website.
| Date | Buyer | Sale Price | Title Company |
|---|---|---|---|
| Cleary Peter | $209,900 | -- | |
| Bourke Donald E | $134,000 | -- |
Source: Public Records
Mortgage History
We collect this data history from publicly available records. To have your information removed, we recommend requesting removal directly through your county’s website.
| Date | Status | Borrower | Loan Amount |
|---|---|---|---|
| Open | Bourke Donald E | $35,946 | |
| Open | Bourke Donald E | $199,405 | |
| Previous Owner | Bourke Donald E | $138,000 | |
| Previous Owner | Bourke Donald E | $110,000 |
Source: Public Records
Tax History
| Year | Tax Paid | Tax Assessment Tax Assessment Total Assessment is a certain percentage of the fair market value that is determined by local assessors to be the total taxable value of land and additions on the property. | Land | Improvement |
|---|---|---|---|---|
| 2025 | $4,396 | $183,260 | $49,140 | $134,120 |
| 2024 | $3,526 | $125,300 | $34,930 | $90,370 |
| 2023 | $3,299 | $125,300 | $34,930 | $90,370 |
| 2022 | $3,236 | $125,300 | $34,930 | $90,370 |
| 2021 | $3,236 | $125,300 | $34,930 | $90,370 |
| 2020 | $3,236 | $125,300 | $34,930 | $90,370 |
| 2019 | $3,236 | $125,300 | $34,930 | $90,370 |
| 2017 | $2,930 | $109,900 | $33,000 | $76,900 |
| 2016 | $2,930 | $109,900 | $33,000 | $76,900 |
| 2015 | $2,944 | $109,900 | $33,000 | $76,900 |
| 2014 | $3,350 | $127,700 | $37,500 | $90,200 |
Source: Public Records
Map
Nearby Homes
- 15 Suffield St
- 31 Suffield St
- 6 James St
- 8 James St
- 0 N Water St Unit 24138494
- 0 N Water St Unit 24128295
- 0 N Water St Unit 24128294
- 0 N Water St Unit 24128288
- 0 N Water St
- 21 Birge Ave
- 7 Cannon St
- 202 Reed Ave
- 66 Woodcock Ct Unit 66
- 50 Chapman Chase Unit 50
- 235 Reed Ave
- 4 Pleasant St
- 10 Center St
- 39 Chapman Chase Unit 39
- 33 Thomas St
- 134 Sunset St
Your Personal Tour Guide
Ask me questions while you tour the home.