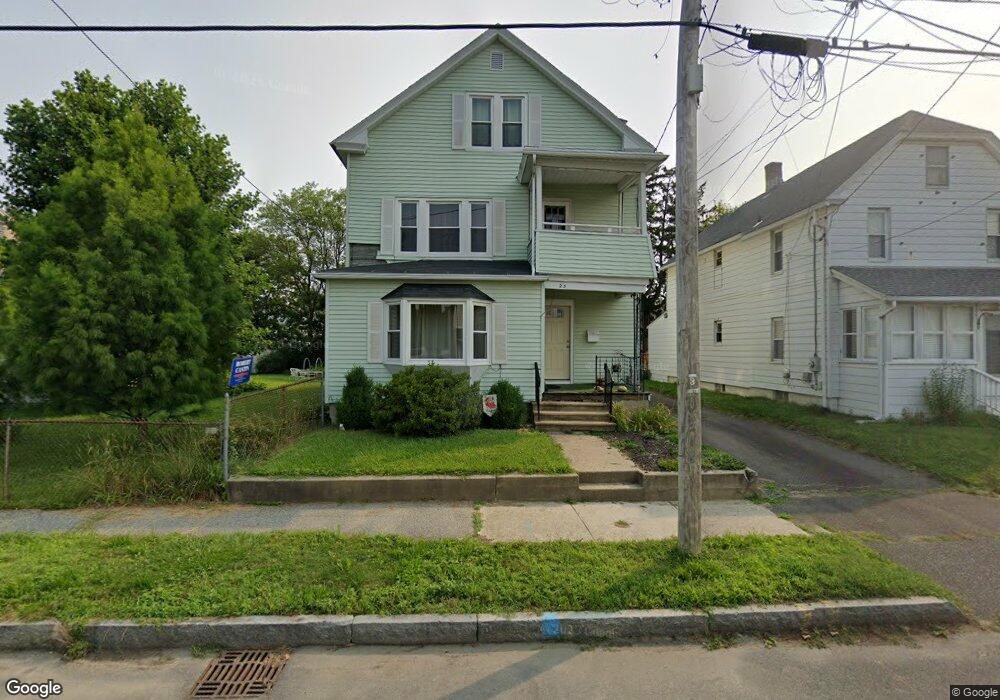
25 Nash St Chicopee, MA 01013
Willimansett NeighborhoodEstimated Value: $304,000 - $476,499
7
Beds
3
Baths
2,720
Sq Ft
$151/Sq Ft
Est. Value
About This Home
This home is located at 25 Nash St, Chicopee, MA 01013 and is currently estimated at $411,625, approximately $151 per square foot. 25 Nash St is a home located in Hampden County with nearby schools including Fairview Elementary School, Bellamy Middle School, and Chicopee Comprehensive High School.
Ownership History
Date
Name
Owned For
Owner Type
Purchase Details
Closed on
Aug 30, 1994
Sold by
Gauthier Donald J and Gauthier Constance J
Bought by
Cantin Thomas G and Cantin Ann M
Current Estimated Value
Home Financials for this Owner
Home Financials are based on the most recent Mortgage that was taken out on this home.
Original Mortgage
$117,792
Interest Rate
8.65%
Mortgage Type
Purchase Money Mortgage
Create a Home Valuation Report for This Property
The Home Valuation Report is an in-depth analysis detailing your home's value as well as a comparison with similar homes in the area
Home Values in the Area
Average Home Value in this Area
Purchase History
| Date | Buyer | Sale Price | Title Company |
|---|---|---|---|
| Cantin Thomas G | $118,000 | -- |
Source: Public Records
Mortgage History
| Date | Status | Borrower | Loan Amount |
|---|---|---|---|
| Open | Cantin Thomas G | $5,000 | |
| Closed | Cantin Thomas G | $117,792 |
Source: Public Records
Tax History Compared to Growth
Tax History
| Year | Tax Paid | Tax Assessment Tax Assessment Total Assessment is a certain percentage of the fair market value that is determined by local assessors to be the total taxable value of land and additions on the property. | Land | Improvement |
|---|---|---|---|---|
| 2025 | $5,080 | $335,100 | $98,700 | $236,400 |
| 2024 | $4,726 | $320,200 | $96,800 | $223,400 |
| 2023 | $4,380 | $289,100 | $88,000 | $201,100 |
| 2022 | $4,338 | $255,300 | $76,500 | $178,800 |
| 2021 | $4,110 | $233,400 | $69,500 | $163,900 |
| 2020 | $3,880 | $222,200 | $69,500 | $152,700 |
| 2019 | $3,926 | $218,600 | $69,500 | $149,100 |
| 2018 | $3,838 | $209,600 | $66,200 | $143,400 |
| 2017 | $3,602 | $208,100 | $66,200 | $141,900 |
| 2016 | $3,220 | $190,400 | $66,200 | $124,200 |
| 2015 | $3,175 | $181,000 | $66,200 | $114,800 |
| 2014 | $2,988 | $181,000 | $66,200 | $114,800 |
Source: Public Records
Map
Nearby Homes
- 18 Charpentier Blvd
- 91 Norman St
- 551 Lafleur Dr
- 47 Dorrance St
- 26 Olivine St
- 39 State St
- 20 Mount Carmel Ave
- 176 Silvin Rd
- 934 Main St
- 861 Grattan St
- 39 Daley St
- 958 Main St
- 12 Temple St
- 5 Vernon St
- 3 Henry St
- 4 Columbia St
- 133-135 Brown Ave
- 15 Riverview Place
- 90 Mckinstry Ave Unit 117
- 210 Clarendon Ave