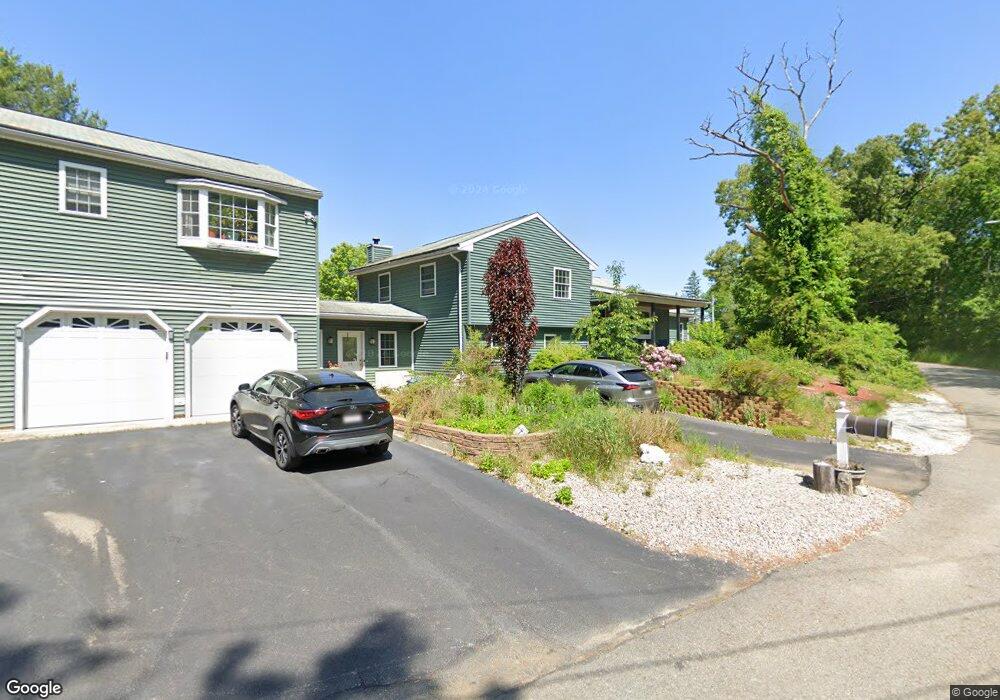
25 Old Elmdale Rd Uxbridge, MA 01569
Estimated Value: $644,000 - $704,000
6
Beds
3
Baths
2,556
Sq Ft
$262/Sq Ft
Est. Value
About This Home
This home is located at 25 Old Elmdale Rd, Uxbridge, MA 01569 and is currently estimated at $669,133, approximately $261 per square foot. 25 Old Elmdale Rd is a home located in Worcester County with nearby schools including Uxbridge High School and Our Lady of the Valley Regional School.
Ownership History
Date
Name
Owned For
Owner Type
Purchase Details
Closed on
May 11, 2018
Sold by
Boutsady Thongsim and Tanakhone Bounmanisone
Bought by
Tanakhone Bounmanisone and Prachith Phanphiloune
Current Estimated Value
Purchase Details
Closed on
Aug 30, 2011
Sold by
Fhlmc
Bought by
Tanakhone Bounmanisone and Thongsim Boutsady
Purchase Details
Closed on
Jul 8, 2010
Sold by
Frasier William J and Wells Fargo Bk
Bought by
Fhlmc
Create a Home Valuation Report for This Property
The Home Valuation Report is an in-depth analysis detailing your home's value as well as a comparison with similar homes in the area
Home Values in the Area
Average Home Value in this Area
Purchase History
| Date | Buyer | Sale Price | Title Company |
|---|---|---|---|
| Tanakhone Bounmanisone | -- | -- | |
| Tanakhone Bounmanisone | $225,000 | -- | |
| Fhlmc | $186,930 | -- |
Source: Public Records
Tax History Compared to Growth
Tax History
| Year | Tax Paid | Tax Assessment Tax Assessment Total Assessment is a certain percentage of the fair market value that is determined by local assessors to be the total taxable value of land and additions on the property. | Land | Improvement |
|---|---|---|---|---|
| 2025 | $65 | $497,000 | $146,800 | $350,200 |
| 2024 | $6,323 | $489,400 | $139,200 | $350,200 |
| 2023 | $6,111 | $438,100 | $120,400 | $317,700 |
| 2022 | $5,818 | $383,800 | $105,400 | $278,400 |
| 2021 | $6,035 | $381,500 | $103,100 | $278,400 |
| 2020 | $6,016 | $359,400 | $99,600 | $259,800 |
| 2019 | $6,156 | $354,800 | $99,600 | $255,200 |
| 2018 | $5,783 | $336,800 | $99,600 | $237,200 |
| 2017 | $5,112 | $301,400 | $96,400 | $205,000 |
| 2016 | $4,962 | $282,400 | $84,500 | $197,900 |
| 2015 | $4,806 | $276,200 | $84,500 | $191,700 |
Source: Public Records
Map
Nearby Homes
- 286 Blackstone St
- 37 Elizabeth St
- 107 Henry St
- 85 East St
- 256 Mendon St
- 24 Road Ahr
- 328 Millville Rd
- 46 Pouts Ln Unit 46
- 346 Millville Rd
- 23 Rifleman Way
- 24 Olde Canal Way Unit 24
- 20 Nature View Dr Unit 20
- 129 Quaker Hwy Unit 6
- 53 Asylum St
- The Contemporary Villager Plan at Patriot's Landing
- Karenrose Sunnery Plan at Patriot's Landing
- 13A Asylum St
- 127 Old Millville Rd
- 72 Homeward Ave
- 48 Homeward Ave