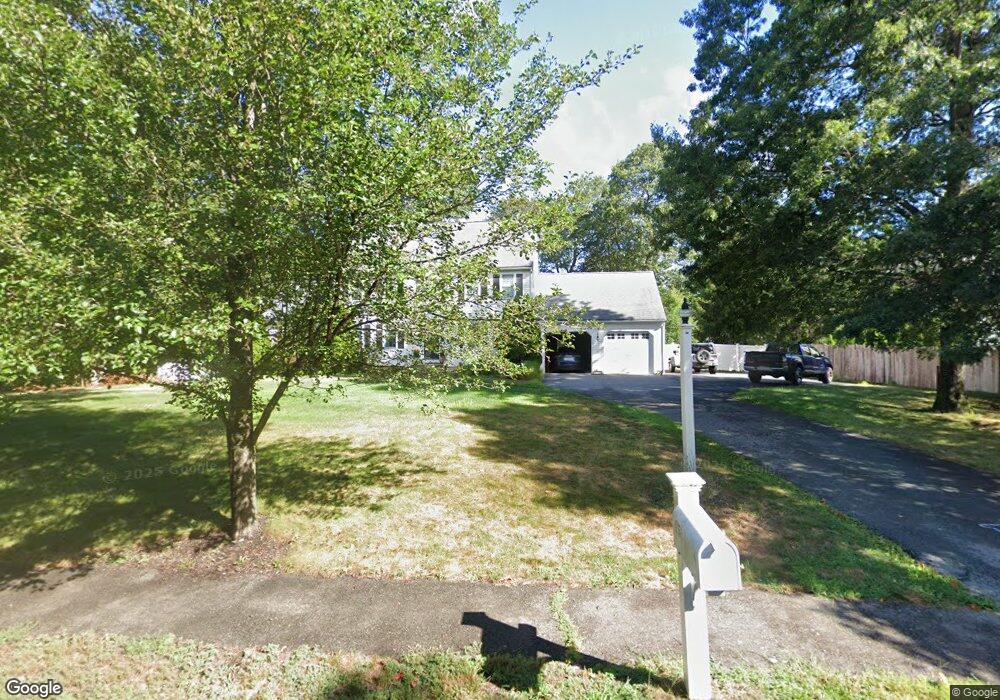
25 Osprey Ln Hanover, MA 02339
Estimated Value: $978,000 - $1,122,000
4
Beds
4
Baths
2,564
Sq Ft
$411/Sq Ft
Est. Value
About This Home
This home is located at 25 Osprey Ln, Hanover, MA 02339 and is currently estimated at $1,053,078, approximately $410 per square foot. 25 Osprey Ln is a home located in Plymouth County with nearby schools including Hanover High School and Calvary Chapel Academy.
Ownership History
Date
Name
Owned For
Owner Type
Purchase Details
Closed on
Aug 29, 2002
Sold by
Williams Bros Inc
Bought by
Pierotti James F and Pierotti Brenda M
Current Estimated Value
Purchase Details
Closed on
Jul 6, 2001
Sold by
Jpd Nt and Davis Francis X
Bought by
Williams Bros Inc
Create a Home Valuation Report for This Property
The Home Valuation Report is an in-depth analysis detailing your home's value as well as a comparison with similar homes in the area
Home Values in the Area
Average Home Value in this Area
Purchase History
| Date | Buyer | Sale Price | Title Company |
|---|---|---|---|
| Pierotti James F | $515,000 | -- | |
| Pierotti James F | $515,000 | -- | |
| Williams Bros Inc | $160,000 | -- | |
| William Bros Inc | $160,000 | -- |
Source: Public Records
Mortgage History
| Date | Status | Borrower | Loan Amount |
|---|---|---|---|
| Open | William Bros Inc | $552,000 | |
| Closed | William Bros Inc | $20,000 | |
| Closed | William Bros Inc | $372,000 |
Source: Public Records
Tax History
| Year | Tax Paid | Tax Assessment Tax Assessment Total Assessment is a certain percentage of the fair market value that is determined by local assessors to be the total taxable value of land and additions on the property. | Land | Improvement |
|---|---|---|---|---|
| 2025 | $12,250 | $991,900 | $324,400 | $667,500 |
| 2024 | $11,636 | $906,200 | $324,400 | $581,800 |
| 2023 | $11,091 | $822,200 | $294,900 | $527,300 |
| 2022 | $10,881 | $713,500 | $258,000 | $455,500 |
| 2021 | $10,845 | $664,100 | $234,500 | $429,600 |
| 2020 | $10,518 | $644,900 | $234,500 | $410,400 |
| 2019 | $10,251 | $624,700 | $245,700 | $379,000 |
| 2018 | $355 | $597,800 | $256,800 | $341,000 |
| 2017 | $9,856 | $596,600 | $254,100 | $342,500 |
| 2016 | $9,539 | $565,800 | $231,100 | $334,700 |
| 2015 | $9,138 | $565,800 | $231,100 | $334,700 |
Source: Public Records
Map
Nearby Homes
- 75 School St
- 561 Circuit St
- 95 Tecumseh Dr
- 696 Summer St
- 823 Market St
- 810 Brookline Way
- 108 Waterford Dr
- 36 Grove St
- 8 Pat Rose Way
- 9 Pat Rose Way
- 51 Cervelli Farm Dr
- 37 Dr
- 23 Cervelli Farm Dr
- 38 Cervelli Farm Dr
- 9 Cervelli Farm Dr
- 250 Center St
- 5 Pat Rose Way
- 10 Birch Bottom Cir
- 9 Old Market St
- 5 Alpine St
Your Personal Tour Guide
Ask me questions while you tour the home.