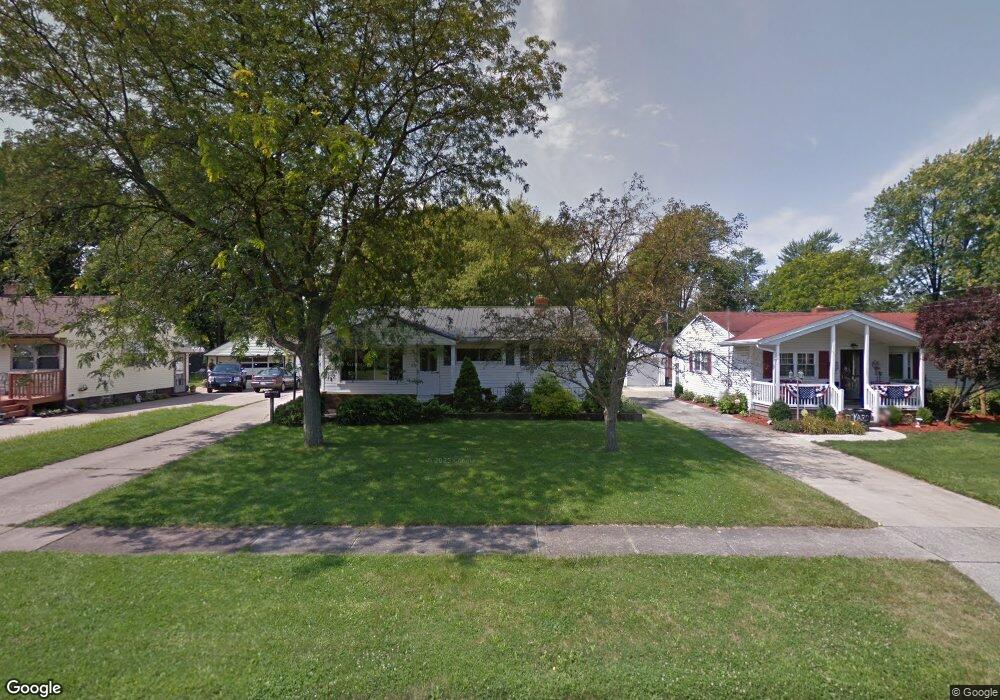
25 Parsons St Norwalk, OH 44857
Estimated Value: $157,000 - $179,594
3
Beds
1
Bath
988
Sq Ft
$174/Sq Ft
Est. Value
About This Home
This home is located at 25 Parsons St, Norwalk, OH 44857 and is currently estimated at $172,149, approximately $174 per square foot. 25 Parsons St is a home located in Huron County with nearby schools including Maplehurst Elementary School, League Elementary School, and Pleasant Elementary School.
Ownership History
Date
Name
Owned For
Owner Type
Purchase Details
Closed on
Mar 15, 2013
Bought by
Dvorak Properties Llc
Current Estimated Value
Home Financials for this Owner
Home Financials are based on the most recent Mortgage that was taken out on this home.
Original Mortgage
$257,000
Outstanding Balance
$52,672
Interest Rate
3.49%
Mortgage Type
Future Advance Clause Open End Mortgage
Estimated Equity
$119,477
Purchase Details
Closed on
Mar 13, 2013
Sold by
Dvorak Abraham T and Dvorak Kate A
Bought by
Dvorak Properties Llc
Home Financials for this Owner
Home Financials are based on the most recent Mortgage that was taken out on this home.
Original Mortgage
$257,000
Outstanding Balance
$52,672
Interest Rate
3.49%
Mortgage Type
Future Advance Clause Open End Mortgage
Estimated Equity
$119,477
Purchase Details
Closed on
Mar 12, 2008
Bought by
Dvorak Abraham T and Dvorak Kate A
Purchase Details
Closed on
Feb 17, 2006
Bought by
Dvorak Abraham T
Purchase Details
Closed on
Feb 15, 1995
Bought by
Summerlin Elizabeth Jane
Create a Home Valuation Report for This Property
The Home Valuation Report is an in-depth analysis detailing your home's value as well as a comparison with similar homes in the area
Home Values in the Area
Average Home Value in this Area
Purchase History
| Date | Buyer | Sale Price | Title Company |
|---|---|---|---|
| Dvorak Properties Llc | -- | -- | |
| Dvorak Properties Llc | -- | Attorney | |
| Dvorak Abraham T | -- | -- | |
| Dvorak Abraham T | $90,000 | -- | |
| Summerlin Elizabeth Jane | -- | -- |
Source: Public Records
Mortgage History
| Date | Status | Borrower | Loan Amount |
|---|---|---|---|
| Open | Dvorak Properties Llc | $257,000 |
Source: Public Records
Tax History Compared to Growth
Tax History
| Year | Tax Paid | Tax Assessment Tax Assessment Total Assessment is a certain percentage of the fair market value that is determined by local assessors to be the total taxable value of land and additions on the property. | Land | Improvement |
|---|---|---|---|---|
| 2024 | $2,178 | $52,410 | $8,460 | $43,950 |
| 2023 | $2,178 | $39,960 | $6,760 | $33,200 |
| 2022 | $1,645 | $39,960 | $6,760 | $33,200 |
| 2021 | $1,646 | $39,960 | $6,760 | $33,200 |
| 2020 | $1,503 | $34,730 | $6,760 | $27,970 |
| 2019 | $1,471 | $34,730 | $6,760 | $27,970 |
| 2018 | $1,446 | $34,730 | $6,760 | $27,970 |
| 2017 | $1,296 | $30,980 | $6,760 | $24,220 |
| 2016 | $1,273 | $30,980 | $6,760 | $24,220 |
| 2015 | $1,272 | $30,990 | $6,770 | $24,220 |
| 2014 | $1,275 | $30,770 | $6,760 | $24,010 |
| 2013 | $1,112 | $30,770 | $6,760 | $24,010 |
Source: Public Records
Map
Nearby Homes
- 45 Grove Ave
- 173 Saint Marys St
- 203 Spino St
- 14 Republic St
- 6 Blossom Dr Unit B
- 154 Gallup Ave
- 123 E Main St
- 0 Milan Ave
- 57 Milan Ave
- 29 Corwin St
- 14 Corwin St
- 34 Old State Rd N
- 121 Leisure Ln
- 6 White Tail Way Unit A
- 0 Cleveland Rd
- 15 E Washington St
- 13 Spring St
- 112 State Route 61 Unit 25
- 85 Woodlawn Ave
- 33 Falcon Crest Dr Unit C