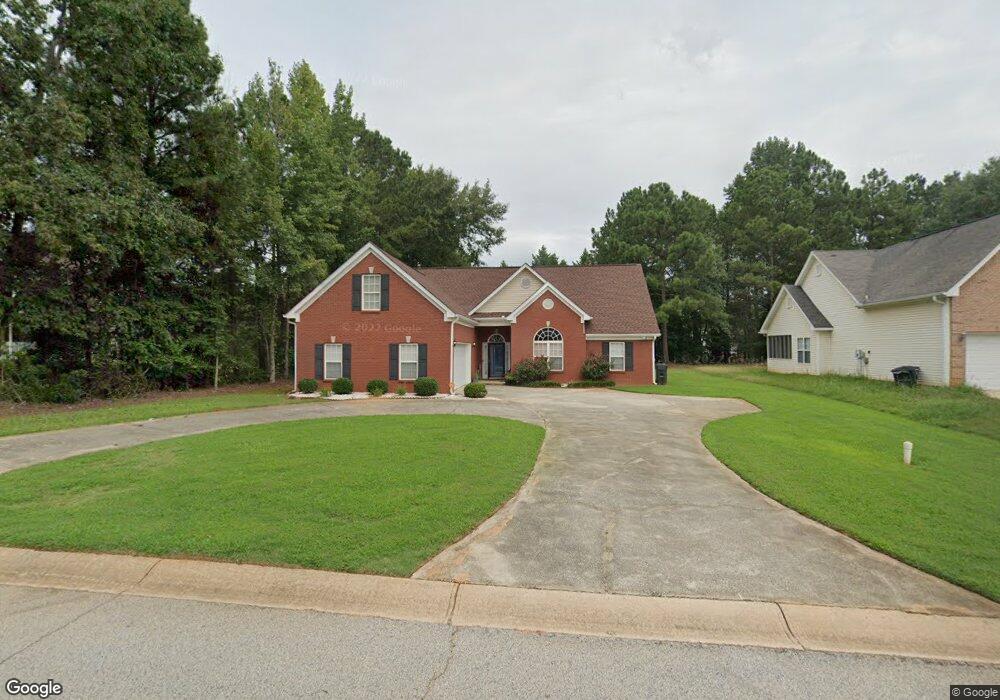
25 Pebble Brooke Ct Covington, GA 30016
Estimated Value: $282,865 - $324,000
Studio
2
Baths
2,017
Sq Ft
$150/Sq Ft
Est. Value
About This Home
This home is located at 25 Pebble Brooke Ct, Covington, GA 30016 and is currently estimated at $302,716, approximately $150 per square foot. 25 Pebble Brooke Ct is a home located in Newton County with nearby schools including West Newton Elementary School, Liberty Middle School, and Newton High School.
Ownership History
Date
Name
Owned For
Owner Type
Purchase Details
Closed on
Nov 20, 2007
Sold by
Davis Debra F
Bought by
Davis Debrah F and Davis Akia
Current Estimated Value
Home Financials for this Owner
Home Financials are based on the most recent Mortgage that was taken out on this home.
Original Mortgage
$166,500
Outstanding Balance
$132,891
Interest Rate
6.29%
Mortgage Type
Stand Alone Second
Estimated Equity
$169,825
Purchase Details
Closed on
Sep 12, 2005
Sold by
Golden Kimberly
Bought by
Davis Debrah F
Home Financials for this Owner
Home Financials are based on the most recent Mortgage that was taken out on this home.
Original Mortgage
$29,960
Interest Rate
5.86%
Mortgage Type
Stand Alone Refi Refinance Of Original Loan
Purchase Details
Closed on
Mar 20, 2002
Sold by
Pebblebrook Llc
Bought by
Kali Construction
Home Financials for this Owner
Home Financials are based on the most recent Mortgage that was taken out on this home.
Original Mortgage
$194,000
Interest Rate
6.86%
Mortgage Type
New Conventional
Create a Home Valuation Report for This Property
The Home Valuation Report is an in-depth analysis detailing your home's value as well as a comparison with similar homes in the area
Home Values in the Area
Average Home Value in this Area
Purchase History
| Date | Buyer | Sale Price | Title Company |
|---|---|---|---|
| Davis Debrah F | $73,500 | -- | |
| Davis Debrah F | $149,800 | -- | |
| Kali Construction | $48,800 | -- |
Source: Public Records
Mortgage History
| Date | Status | Borrower | Loan Amount |
|---|---|---|---|
| Open | Davis Debrah F | $166,500 | |
| Previous Owner | Davis Debrah F | $29,960 | |
| Previous Owner | Kali Construction | $194,000 |
Source: Public Records
Tax History
| Year | Tax Paid | Tax Assessment Tax Assessment Total Assessment is a certain percentage of the fair market value that is determined by local assessors to be the total taxable value of land and additions on the property. | Land | Improvement |
|---|---|---|---|---|
| 2025 | $3,096 | $129,240 | $16,000 | $113,240 |
| 2024 | $2,983 | $119,360 | $16,000 | $103,360 |
| 2023 | $3,476 | $129,840 | $7,600 | $122,240 |
| 2022 | $2,282 | $85,840 | $7,600 | $78,240 |
| 2021 | $2,316 | $78,360 | $7,600 | $70,760 |
| 2020 | $2,166 | $66,680 | $7,600 | $59,080 |
| 2019 | $2,067 | $62,840 | $7,600 | $55,240 |
| 2018 | $1,787 | $54,320 | $7,600 | $46,720 |
| 2017 | $1,791 | $54,440 | $7,600 | $46,840 |
| 2016 | $1,587 | $48,480 | $4,000 | $44,480 |
| 2015 | $1,409 | $43,800 | $4,000 | $39,800 |
| 2014 | $1,197 | $37,680 | $0 | $0 |
Source: Public Records
Map
Nearby Homes
- 740 Pebble Blvd
- 385 Creekview Blvd
- 210 Mary Jane Ln
- 2093 Blackbird Cir
- 41 Woodland Rd
- 164 Mary Jane Ln
- 3789 Salem Rd
- 500 Shiver Blvd
- 280 Mackenzie Ct
- 230 Mackenzie Ct
- 100 Wisteria Cir
- 45 Somerset Ct
- 115 Buck Creek Dr
- 45 Sunset Ct
- 50 Amberjack Trail
- 35 Summit Dr
- 160 Wisteria Blvd
- 12462 Brown Bridge Rd
- 25 Buckeye Cir
- 30 Cinnamon Fern Cir
- 35 Pebble Brooke Ct
- 710 Pebble Blvd
- 45 Pebble Brooke Ct
- 20 Pebble Ln
- 20 Pebble Ln Unit 43
- 30 Pebble Ln
- 720 Pebble Blvd
- 20 Pebble Brooke Ct Unit 1
- 40 Pebble Ln
- 30 Pebble Brooke Ct Unit 3
- 30 Pebble Brooke Ct
- 690 Pebble Blvd
- 55 Pebble Brooke Ct
- 705 Pebble Blvd
- 715 Pebble Blvd
- 715 Pebble Blvd Unit 36
- 725 Pebble Blvd
- 705 Pebble Blvd Unit 35
- 705 Pebble Blvd
- 50 Pebble Ln
Your Personal Tour Guide
Ask me questions while you tour the home.