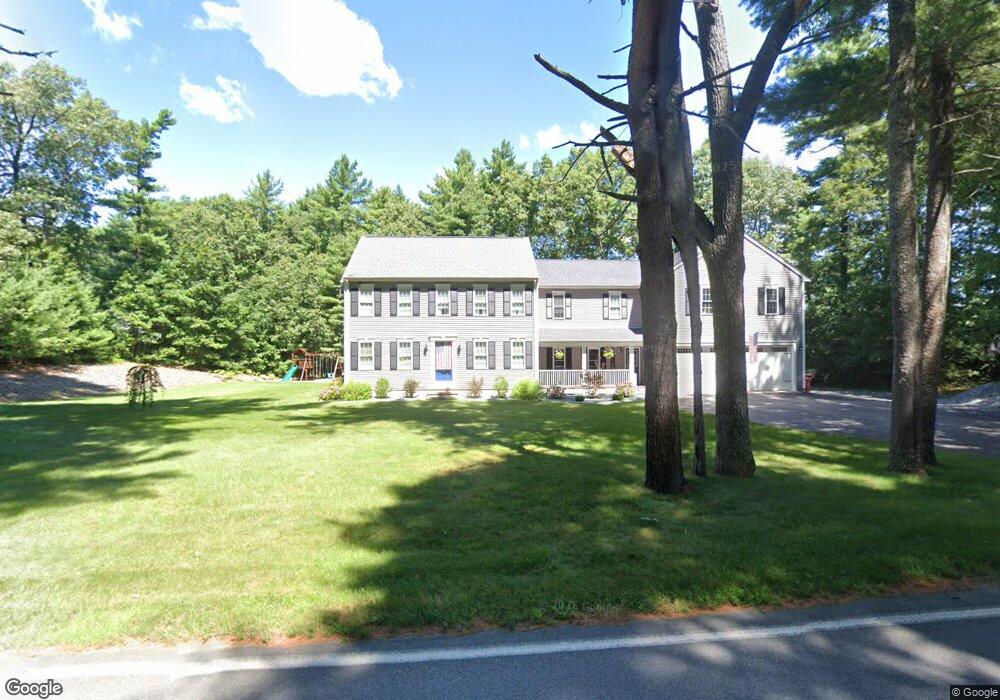
25 Pine St Middleboro, MA 02346
Estimated Value: $678,000 - $774,000
4
Beds
2
Baths
2,669
Sq Ft
$268/Sq Ft
Est. Value
About This Home
This home is located at 25 Pine St, Middleboro, MA 02346 and is currently estimated at $715,907, approximately $268 per square foot. 25 Pine St is a home with nearby schools including Mary K. Goode Elementary School.
Ownership History
Date
Name
Owned For
Owner Type
Purchase Details
Closed on
Apr 16, 2010
Sold by
Scanlon John M
Bought by
Oconnell Daniel S and Oconnell Sara N
Current Estimated Value
Home Financials for this Owner
Home Financials are based on the most recent Mortgage that was taken out on this home.
Original Mortgage
$235,000
Outstanding Balance
$156,285
Interest Rate
4.97%
Mortgage Type
Purchase Money Mortgage
Estimated Equity
$559,622
Purchase Details
Closed on
Mar 11, 2010
Sold by
P J Rt and Logan William R
Bought by
Scanlon Constr Co Llc
Home Financials for this Owner
Home Financials are based on the most recent Mortgage that was taken out on this home.
Original Mortgage
$235,000
Outstanding Balance
$156,285
Interest Rate
4.97%
Mortgage Type
Purchase Money Mortgage
Estimated Equity
$559,622
Create a Home Valuation Report for This Property
The Home Valuation Report is an in-depth analysis detailing your home's value as well as a comparison with similar homes in the area
Home Values in the Area
Average Home Value in this Area
Purchase History
| Date | Buyer | Sale Price | Title Company |
|---|---|---|---|
| Oconnell Daniel S | $310,000 | -- | |
| Scanlon Constr Co Llc | $130,000 | -- |
Source: Public Records
Mortgage History
| Date | Status | Borrower | Loan Amount |
|---|---|---|---|
| Open | Oconnell Daniel S | $235,000 |
Source: Public Records
Tax History
| Year | Tax Paid | Tax Assessment Tax Assessment Total Assessment is a certain percentage of the fair market value that is determined by local assessors to be the total taxable value of land and additions on the property. | Land | Improvement |
|---|---|---|---|---|
| 2025 | $8,682 | $647,400 | $172,000 | $475,400 |
| 2024 | $8,752 | $646,400 | $164,000 | $482,400 |
| 2023 | $7,902 | $554,900 | $164,000 | $390,900 |
| 2022 | $7,316 | $475,700 | $142,400 | $333,300 |
| 2021 | $7,232 | $444,500 | $124,800 | $319,700 |
| 2020 | $7,005 | $441,100 | $124,800 | $316,300 |
| 2019 | $6,828 | $441,100 | $124,800 | $316,300 |
| 2018 | $6,622 | $424,500 | $118,600 | $305,900 |
| 2017 | $6,064 | $384,500 | $114,000 | $270,500 |
| 2016 | $5,989 | $376,200 | $108,000 | $268,200 |
| 2015 | $4,628 | $293,300 | $108,000 | $185,300 |
Source: Public Records
Map
Nearby Homes
Your Personal Tour Guide
Ask me questions while you tour the home.