Estimated Value: $241,252 - $333,000
3
Beds
2
Baths
1,725
Sq Ft
$159/Sq Ft
Est. Value
About This Home
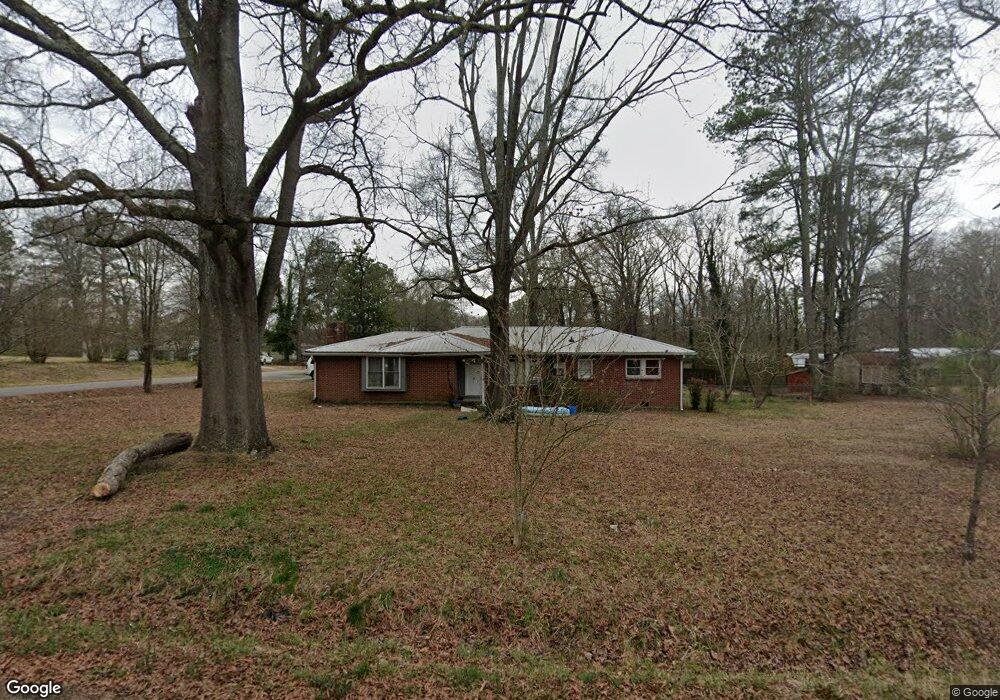
This home is located at 25 Pinecrest Dr NW, Rome, GA 30165 and is currently estimated at $274,813, approximately $159 per square foot. 25 Pinecrest Dr NW is a home located in Floyd County with nearby schools including Coosa Middle School and Coosa High School.
Ownership History
Date
Name
Owned For
Owner Type
Purchase Details
Closed on
Dec 22, 2011
Sold by
Monty
Bought by
Boswell Shelor H
Current Estimated Value
Purchase Details
Closed on
Nov 24, 2010
Sold by
Holtzclaw William Chase
Bought by
Monty
Purchase Details
Closed on
Dec 11, 2008
Sold by
Umphrey James L
Bought by
Holtzclaw Chase
Purchase Details
Closed on
May 1, 1974
Sold by
West J C
Bought by
Umphrey James L and Umphrey Sarah E
Purchase Details
Closed on
Oct 12, 1973
Sold by
Thompson Glenda F
Bought by
West J C
Purchase Details
Closed on
Jun 11, 1973
Sold by
Thompson Jerry W and Thompson Glenda F
Bought by
Thompson Glenda F
Purchase Details
Closed on
Jun 6, 1970
Sold by
Smith Wm R and Smith Frances
Bought by
Thompson Jerry W and Thompson Glenda F
Purchase Details
Closed on
Nov 22, 1968
Sold by
Handley W B
Bought by
Smith Wm R and Smith Frances
Purchase Details
Closed on
Jan 1, 1960
Bought by
Handley W B
Create a Home Valuation Report for This Property
The Home Valuation Report is an in-depth analysis detailing your home's value as well as a comparison with similar homes in the area
Home Values in the Area
Average Home Value in this Area
Purchase History
| Date | Buyer | Sale Price | Title Company |
|---|---|---|---|
| Boswell Shelor H | $12,000 | -- | |
| Boswell Shelor H | $12,000 | -- | |
| Monty | -- | -- | |
| Monty | -- | -- | |
| Holtzclaw Chase | $119,000 | -- | |
| Umphrey James L | $1,500 | -- | |
| West J C | $17,800 | -- | |
| Thompson Glenda F | $1,000 | -- | |
| Thompson Jerry W | -- | -- | |
| Smith Wm R | $13,000 | -- | |
| Handley W B | -- | -- |
Source: Public Records
Tax History Compared to Growth
Tax History
| Year | Tax Paid | Tax Assessment Tax Assessment Total Assessment is a certain percentage of the fair market value that is determined by local assessors to be the total taxable value of land and additions on the property. | Land | Improvement |
|---|---|---|---|---|
| 2024 | $2,389 | $77,339 | $10,692 | $66,647 |
| 2023 | $2,213 | $63,608 | $9,720 | $53,888 |
| 2022 | $1,579 | $53,231 | $7,776 | $45,455 |
| 2021 | $1,479 | $49,015 | $7,776 | $41,239 |
| 2020 | $1,593 | $52,334 | $6,075 | $46,259 |
| 2019 | $1,497 | $49,856 | $6,075 | $43,781 |
| 2018 | $1,425 | $47,348 | $6,075 | $41,273 |
| 2017 | $1,382 | $45,844 | $6,075 | $39,769 |
| 2016 | $1,355 | $44,420 | $6,040 | $38,380 |
| 2015 | $1,325 | $44,420 | $6,040 | $38,380 |
| 2014 | $1,325 | $44,420 | $6,040 | $38,380 |
Source: Public Records
Map
Nearby Homes
- 1 Ann Dr NW
- 4485 Alabama Hwy
- 10 Nest Dr NW
- 48 Atwood Dr NW
- 293 N Avery Rd NW
- 86 N Avery Rd NW
- 53 Northside Dr NW
- 45 Albert Ave NW
- 4813 Alabama Hwy SW
- 87 Northside Dr NW
- 5 Red Fox Dr SW
- 775 Mays Bridge Rd SW
- 43 Brownlow Dr NW
- 0 Charleston Dr NW Unit 10543945
- 0 Charleston Dr NW Unit 7598114
- 26 Red Fox Dr SW
- 16 Polaris Terrace NW
- 33 Cedar Ln NW
- 31 Cedar Ln NW
- 0 Alabama Hwy Unit 10590171
- 11 Ann Dr NW
- 31 Pinecrest Dr NW
- 26 Pinecrest Dr NW
- 37 Pinecrest Dr NW
- 28 Pinecrest Dr NW
- 9 Ann Dr NW
- 12 Ann Dr NW
- 24 Pinecrest Dr NW
- 30 Pinecrest Dr NW
- 41 Pinecrest Dr NW
- 41 Pinecrest Dr NW
- 19 Pinecrest Dr NW
- 19 Pinecrest Dr NW
- 19 Pinecrest Dr NW
- 32 Pinecrest Dr NW
- 10 Ann Dr NW
- 22 Pinecrest Dr NW
- 22 Pinecrest Dr NW
- 36 Pinecrest Dr NW
- 34 Pinecrest Dr NW