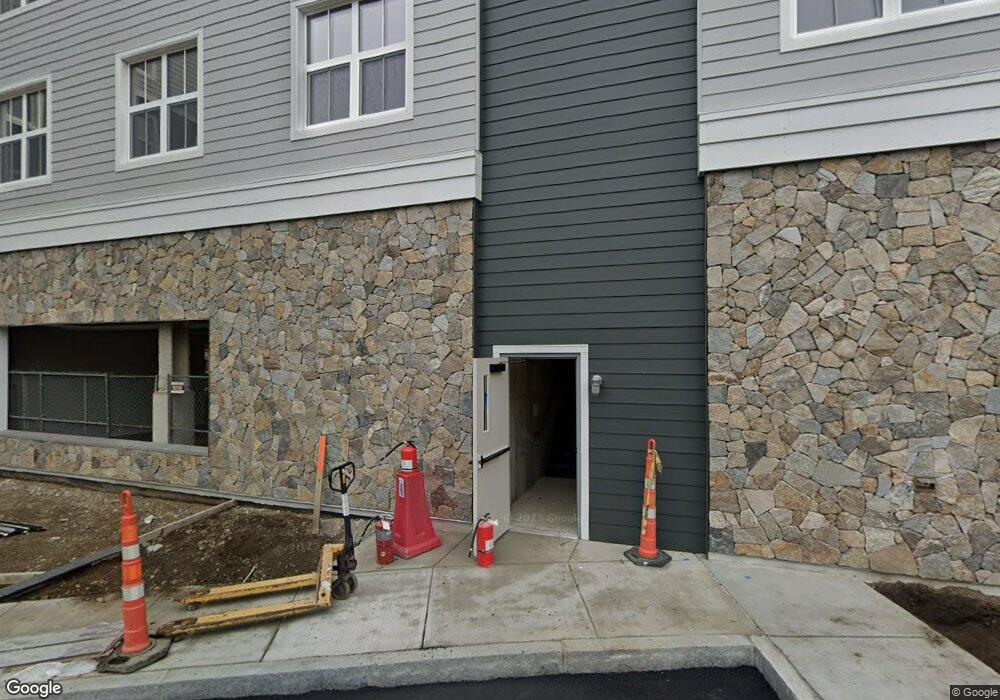
25 Pitman Rd Swampscott, MA 01907
Estimated Value: $451,467
--
Bed
2
Baths
3,466
Sq Ft
$130/Sq Ft
Est. Value
About This Home
This home is located at 25 Pitman Rd, Swampscott, MA 01907 and is currently priced at $451,467, approximately $130 per square foot. 25 Pitman Rd is a home located in Essex County with nearby schools including Swampscott Middle School and Swampscott High School.
Ownership History
Date
Name
Owned For
Owner Type
Purchase Details
Closed on
Jun 23, 2023
Sold by
21 Elm Place Rt and Paradise
Bought by
21 Elm Place Lot 1 Llc
Current Estimated Value
Purchase Details
Closed on
Jun 22, 2023
Sold by
Oceanvilla Llc
Bought by
21 Elm Place Rt and Paradise
Purchase Details
Closed on
Oct 19, 2020
Sold by
25 Pitman Road Ret and Paradise
Bought by
Ocean Villa Llc
Purchase Details
Closed on
Feb 25, 2020
Sold by
Dimento Carol A and Dimento William R
Bought by
25 Pitman Road Ret and Paradise
Home Financials for this Owner
Home Financials are based on the most recent Mortgage that was taken out on this home.
Original Mortgage
$225,000
Interest Rate
3.6%
Mortgage Type
Commercial
Purchase Details
Closed on
Aug 18, 1998
Sold by
Doctors Office Bldg Rt and Culliton
Bought by
Dimento William R and Dimento Carol A
Home Financials for this Owner
Home Financials are based on the most recent Mortgage that was taken out on this home.
Original Mortgage
$200,000
Interest Rate
6.94%
Mortgage Type
Commercial
Purchase Details
Closed on
Jun 13, 1991
Sold by
Alexander Lawrence G
Bought by
Cassetta James
Create a Home Valuation Report for This Property
The Home Valuation Report is an in-depth analysis detailing your home's value as well as a comparison with similar homes in the area
Home Values in the Area
Average Home Value in this Area
Purchase History
| Date | Buyer | Sale Price | Title Company |
|---|---|---|---|
| 21 Elm Place Lot 1 Llc | -- | None Available | |
| 21 Elm Place Lot 1 Llc | -- | None Available | |
| 21 Elm Place Lot 1 Llc | -- | None Available | |
| 21 Elm Place Rt | $700,000 | None Available | |
| 21 Elm Place Rt | $700,000 | None Available | |
| 21 Elm Place Rt | $700,000 | None Available | |
| Ocean Villa Llc | -- | None Available | |
| Ocean Villa Llc | -- | None Available | |
| Ocean Villa Llc | -- | None Available | |
| 25 Pitman Road Ret | $325,000 | None Available | |
| 25 Pitman Road Ret | $325,000 | None Available | |
| 25 Pitman Road Ret | $325,000 | None Available | |
| Dimento William R | $150,000 | -- | |
| Dimento William R | $150,000 | -- | |
| Cassetta James | $60,000 | -- | |
| Cassetta James | $60,000 | -- |
Source: Public Records
Mortgage History
| Date | Status | Borrower | Loan Amount |
|---|---|---|---|
| Previous Owner | 25 Pitman Road Ret | $225,000 | |
| Previous Owner | Cassetta James | $250,000 | |
| Previous Owner | Cassetta James | $200,000 |
Source: Public Records
Tax History Compared to Growth
Tax History
| Year | Tax Paid | Tax Assessment Tax Assessment Total Assessment is a certain percentage of the fair market value that is determined by local assessors to be the total taxable value of land and additions on the property. | Land | Improvement |
|---|---|---|---|---|
| 2025 | $9,181 | $433,700 | $335,900 | $97,800 |
| 2024 | $7,252 | $341,600 | $243,800 | $97,800 |
| 2023 | $6,670 | $317,000 | $227,600 | $89,400 |
| 2022 | $7,190 | $309,900 | $211,300 | $98,600 |
| 2021 | $7,692 | $308,900 | $178,800 | $130,100 |
| 2020 | $7,985 | $308,900 | $178,800 | $130,100 |
| 2019 | $9,440 | $343,900 | $162,500 | $181,400 |
| 2018 | $9,018 | $312,800 | $146,300 | $166,500 |
| 2017 | $9,003 | $279,600 | $113,800 | $165,800 |
| 2016 | $8,967 | $279,600 | $113,800 | $165,800 |
| 2015 | $8,872 | $279,600 | $113,800 | $165,800 |
| 2014 | $8,990 | $258,400 | $108,100 | $150,300 |
Source: Public Records
Map
Nearby Homes
- 106 Norfolk Ave
- 80 Norfolk Ave Unit 1
- 189 Burrill St Unit 2
- 29-31 Essex Ave Unit 2
- 98 Paradise Rd
- 76 Stetson Ave
- 30 Paradise Rd
- 44 Cherry St Unit 2
- 100 Burpee Rd
- 133 Eastern Ave Unit 8
- 108-110 Burrill St Unit 1
- 51 Barnstable St
- 35 Columbia Ave
- 59 Essex St Unit 59B
- 7-9 Rock Ave
- 28 Claremont Terrace Unit 6
- 306 Paradise Rd
- 26 Groveland St
- 309 Paradise Rd
- 46 Wardwell Ave
- 30 Pitman Rd
- 94 Norfolk Ave
- 88 Norfolk Ave Unit 90
- 88 Norfolk Ave Unit 1
- 102 Norfolk Ave
- 98 Norfolk Ave
- 98 Norfolk Ave Unit 1
- 34 Pitman Rd
- 35 Pitman Rd
- 251 Burrill St
- 255 Burrill St
- 86 Norfolk Ave
- 117 Essex St
- 117 Essex St Unit 1
- 257 Burrill St
- 259 Burrill St
- 84 Norfolk Ave
- 121 Essex St
- 235 Burrill St
- 110 Norfolk Ave