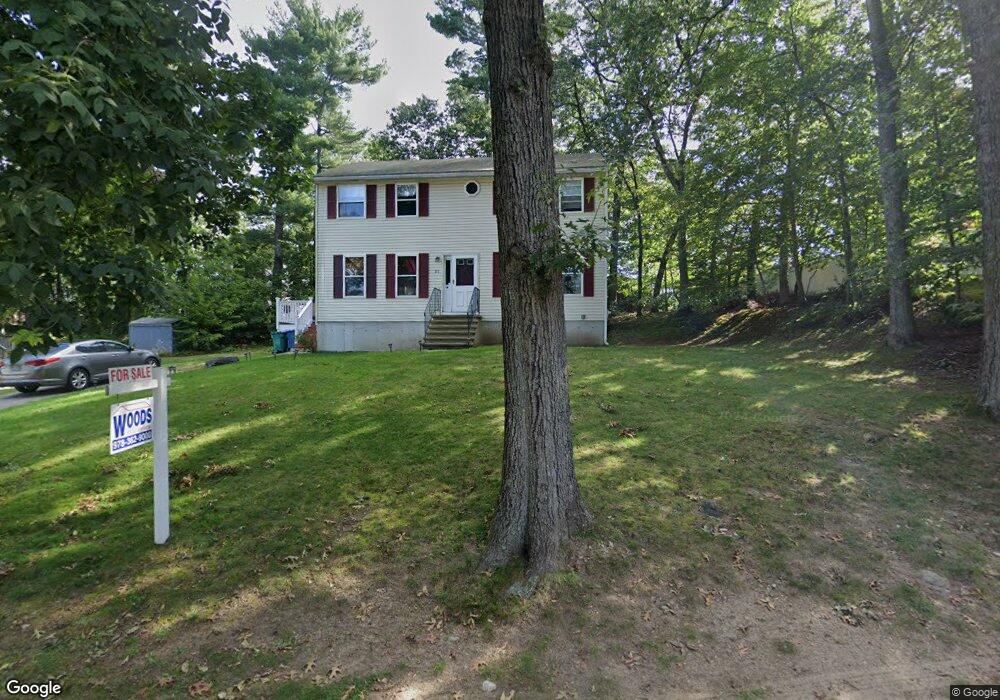
25 Pond Lane Extension Billerica, MA 01821
Estimated Value: $764,462 - $879,000
3
Beds
3
Baths
2,122
Sq Ft
$383/Sq Ft
Est. Value
About This Home
This home is located at 25 Pond Lane Extension, Billerica, MA 01821 and is currently estimated at $812,116, approximately $382 per square foot. 25 Pond Lane Extension is a home located in Middlesex County with nearby schools including Billerica Memorial High School.
Ownership History
Date
Name
Owned For
Owner Type
Purchase Details
Closed on
Dec 29, 2008
Sold by
Miao Wu
Bought by
Bannister Brian and Marini Lauren
Current Estimated Value
Purchase Details
Closed on
May 19, 2006
Sold by
Miao Wu and Guo Xiaoqing
Bought by
Miao Wu
Purchase Details
Closed on
Jan 16, 2004
Sold by
Pasquale Michelle P and Trainor Michelle P
Bought by
Miao Wu and Guo Xiaoqing
Purchase Details
Closed on
Jan 21, 2000
Sold by
Shawsheen Woods Rt and Cooke
Bought by
Nawn Christopher D and Nawn Christina B
Purchase Details
Closed on
Sep 1, 1994
Sold by
George Allen & Son
Bought by
Trainor Sean P and Pasquale Michelle
Purchase Details
Closed on
Apr 1, 1994
Sold by
Kendall Frederick and Kendall Joyce Ann
Bought by
George Allen & Son
Create a Home Valuation Report for This Property
The Home Valuation Report is an in-depth analysis detailing your home's value as well as a comparison with similar homes in the area
Home Values in the Area
Average Home Value in this Area
Purchase History
| Date | Buyer | Sale Price | Title Company |
|---|---|---|---|
| Bannister Brian | $319,000 | -- | |
| Miao Wu | -- | -- | |
| Miao Wu | $348,000 | -- | |
| Nawn Christopher D | $210,231 | -- | |
| Trainor Sean P | $138,000 | -- | |
| George Allen & Son | $100,000 | -- |
Source: Public Records
Mortgage History
| Date | Status | Borrower | Loan Amount |
|---|---|---|---|
| Open | George Allen & Son | $309,060 | |
| Closed | George Allen & Son | $322,016 |
Source: Public Records
Tax History Compared to Growth
Tax History
| Year | Tax Paid | Tax Assessment Tax Assessment Total Assessment is a certain percentage of the fair market value that is determined by local assessors to be the total taxable value of land and additions on the property. | Land | Improvement |
|---|---|---|---|---|
| 2025 | $7,167 | $630,300 | $278,200 | $352,100 |
| 2024 | $6,841 | $605,900 | $260,600 | $345,300 |
| 2023 | $6,613 | $557,100 | $233,400 | $323,700 |
| 2022 | $5,960 | $471,500 | $202,900 | $268,600 |
| 2021 | $5,195 | $399,600 | $184,000 | $215,600 |
| 2020 | $5,019 | $386,400 | $176,800 | $209,600 |
| 2019 | $4,997 | $370,700 | $173,500 | $197,200 |
| 2018 | $4,762 | $335,600 | $151,900 | $183,700 |
| 2017 | $4,537 | $322,000 | $150,600 | $171,400 |
| 2016 | $4,390 | $310,500 | $139,100 | $171,400 |
| 2015 | $4,359 | $310,500 | $139,100 | $171,400 |
| 2014 | $4,343 | $303,900 | $129,000 | $174,900 |
Source: Public Records
Map
Nearby Homes
- 1 Fenner St
- 110 Friendship St
- 86 Lexington Rd
- 88 Lexington Rd
- 8 Water St
- 56 Glad Valley Dr
- 463 Middlesex Turnpike
- 454 Middlesex Turnpike
- 10 Pearl Rd
- 32 Marshall St
- 14 Kenmar Dr Unit 111
- 28 Kenmar Dr Unit 283
- 30 Wyman Rd
- 120 Concord Rd
- 5 Karen Cir Unit 16
- 5 Day St
- 37 Porter St
- 10 Wentworth Dr
- 405 Boston Rd Unit 2
- 33 Pages Ct
- 25 Pond Lane Extension
- 26 Pond Lane Extension
- 23 Pond Lane Extension
- 42 Friendship St
- 24 Country Ln
- 44 Friendship St
- 40 Friendship St
- 22 Pond Lane Extension
- 38 Friendship St
- 26 Country Ln
- 20 Pond Lane Extension
- 48 Friendship St
- 32 Country Ln
- 21 Exeter Place
- 41 Friendship St
- 23 Exeter Place
- 18 Country Ln
- 27 Country Ln
- 37 Friendship St
- 10 Cove St