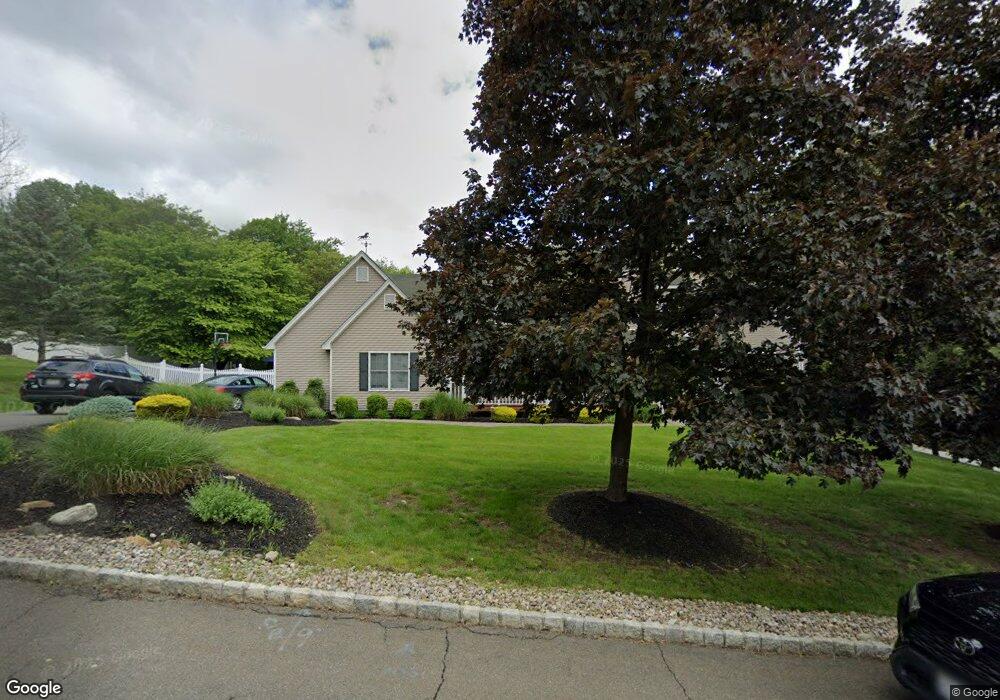
25 Pyngyp Rd Stony Point, NY 10980
Estimated Value: $968,000 - $1,118,000
5
Beds
3
Baths
3,291
Sq Ft
$319/Sq Ft
Est. Value
About This Home
This home is located at 25 Pyngyp Rd, Stony Point, NY 10980 and is currently estimated at $1,049,881, approximately $319 per square foot. 25 Pyngyp Rd is a home located in Rockland County with nearby schools including James A. Farley Middle School, Stony Point Elementary School, and Fieldstone Secondary School.
Ownership History
Date
Name
Owned For
Owner Type
Purchase Details
Closed on
Feb 5, 2003
Sold by
Eccleston John J and Rogers Jeannie M
Bought by
Mallozzi Ralph and Mallozzi Christa
Current Estimated Value
Home Financials for this Owner
Home Financials are based on the most recent Mortgage that was taken out on this home.
Original Mortgage
$490,000
Outstanding Balance
$210,466
Interest Rate
5.99%
Estimated Equity
$839,415
Purchase Details
Closed on
Oct 3, 2000
Sold by
Eccleston John J and Eccleston Jeannie M
Bought by
Eccleston John J and Eccleston Jeannie M
Create a Home Valuation Report for This Property
The Home Valuation Report is an in-depth analysis detailing your home's value as well as a comparison with similar homes in the area
Home Values in the Area
Average Home Value in this Area
Purchase History
| Date | Buyer | Sale Price | Title Company |
|---|---|---|---|
| Mallozzi Ralph | $612,500 | Lawyers Title Insurance Corp | |
| Eccleston John J | -- | -- |
Source: Public Records
Mortgage History
| Date | Status | Borrower | Loan Amount |
|---|---|---|---|
| Open | Mallozzi Ralph | $490,000 |
Source: Public Records
Tax History Compared to Growth
Tax History
| Year | Tax Paid | Tax Assessment Tax Assessment Total Assessment is a certain percentage of the fair market value that is determined by local assessors to be the total taxable value of land and additions on the property. | Land | Improvement |
|---|---|---|---|---|
| 2024 | $26,449 | $77,100 | $11,000 | $66,100 |
| 2023 | $26,449 | $77,100 | $11,000 | $66,100 |
| 2022 | $7,084 | $77,100 | $11,000 | $66,100 |
| 2021 | $7,084 | $77,100 | $11,000 | $66,100 |
| 2020 | $20,920 | $77,100 | $11,000 | $66,100 |
| 2019 | $5,509 | $77,100 | $11,000 | $66,100 |
| 2018 | $20,603 | $77,100 | $11,000 | $66,100 |
| 2017 | $20,443 | $77,100 | $11,000 | $66,100 |
| 2016 | $20,964 | $77,100 | $11,000 | $66,100 |
| 2015 | -- | $77,100 | $11,000 | $66,100 |
| 2014 | -- | $77,100 | $11,000 | $66,100 |
Source: Public Records
Map
Nearby Homes