25 Ross Ave Chicopee, MA 01020
Fairview NeighborhoodEstimated Value: $315,938 - $327,000
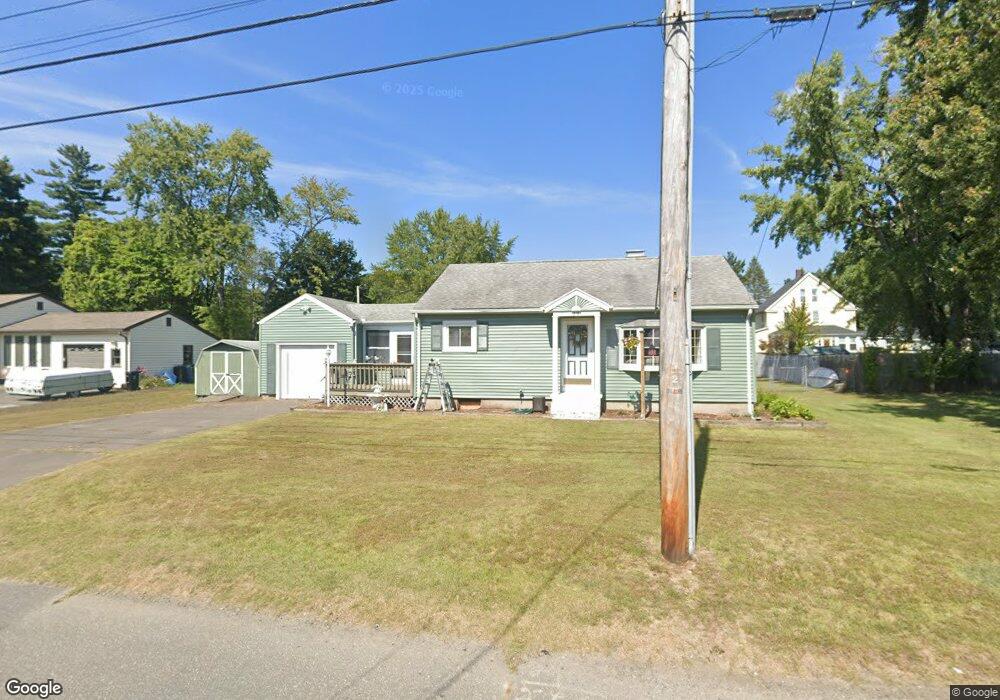
About This Home
This home is located at 25 Ross Ave, Chicopee, MA 01020 and is currently estimated at $321,735, approximately $305 per square foot. 25 Ross Ave is a home located in Hampden County with nearby schools including Streiber Elementary School, Fairview Middle School, and Chicopee Comprehensive High School.
Ownership History
We collect this data history from publicly available records. To have your information removed, we recommend requesting removal directly through your county’s website.
Purchase Details
Home Financials for this Owner
Home Financials are based on the most recent Mortgage that was taken out on this home.Purchase Details
Home Values in the Area
Average Home Value in this Area
Purchase History
We collect this data history from publicly available records. To have your information removed, we recommend requesting removal directly through your county’s website.
| Date | Buyer | Sale Price | Title Company |
|---|---|---|---|
| $321,000 | -- | ||
| -- | -- | ||
| -- | -- |
Mortgage History
We collect this data history from publicly available records. To have your information removed, we recommend requesting removal directly through your county’s website.
| Date | Status | Borrower | Loan Amount |
|---|---|---|---|
| Open | $315,185 |
Tax History
We collect this data history from publicly available records. To have your information removed, we recommend requesting removal directly through your county’s website.
| Year | Tax Paid | Tax Assessment Tax Assessment Total Assessment is a certain percentage of the fair market value that is determined by local assessors to be the total taxable value of land and additions on the property. | Land | Improvement |
|---|---|---|---|---|
| 2025 | $3,960 | $261,200 | $112,000 | $149,200 |
| 2024 | $3,758 | $254,600 | $109,800 | $144,800 |
| 2023 | $3,556 | $234,700 | $99,800 | $134,900 |
| 2022 | $3,401 | $200,200 | $86,700 | $113,500 |
| 2021 | $3,230 | $183,400 | $78,900 | $104,500 |
| 2020 | $3,122 | $178,800 | $81,100 | $97,700 |
| 2019 | $3,089 | $172,000 | $81,100 | $90,900 |
| 2018 | $3,017 | $164,800 | $77,300 | $87,500 |
| 2017 | $2,901 | $167,600 | $70,900 | $96,700 |
| 2016 | $2,968 | $175,500 | $70,900 | $104,600 |
| 2015 | $2,785 | $158,800 | $70,900 | $87,900 |
| 2014 | $1,393 | $158,800 | $70,900 | $87,900 |
Map
- 67 Manning St
- 523 James St
- 79 Beaudry Ave
- 33 Guerin St
- 0 Saint Jacques Ave
- 81 Mccarthy Ave
- 32 Yorktown Ct Unit 32
- 200 Royal St
- 98 Greenpoint Cir
- 128 Ann St
- 35 N Summer St
- 6 Center St
- 14 Hillside Ave
- 83 Buckley Blvd
- 10 Lawrence Ave
- 345-363 Dwight St
- 16 N Main St
- 79 Granby Rd
- 99-101 High St
- 125 Greenwood Terrace
Ask me questions while you tour the home.