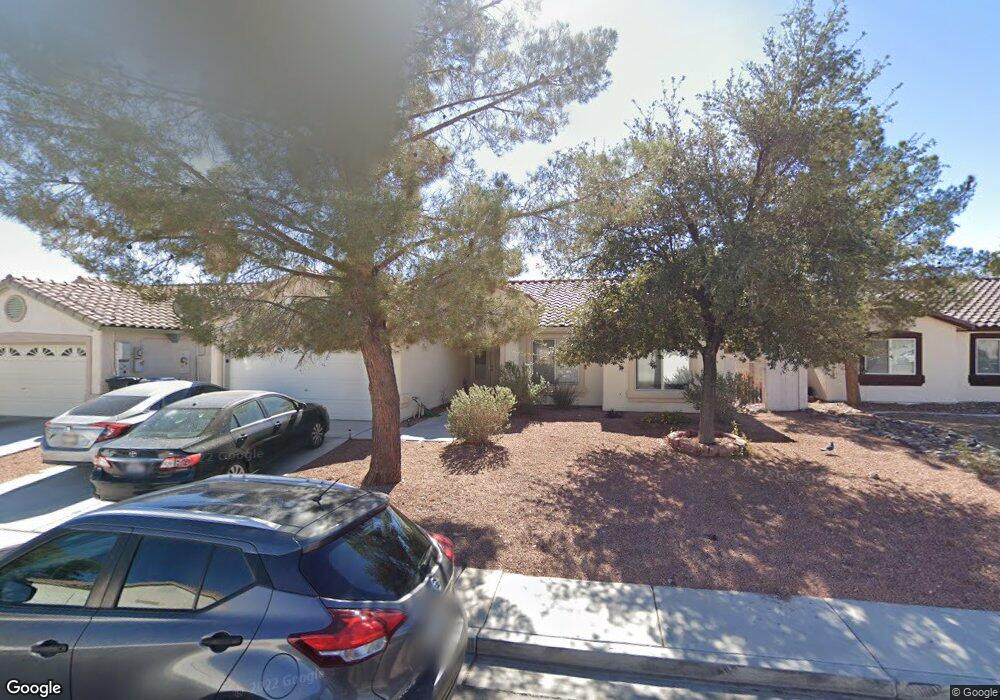
25 Ruby Fountain Ave North Las Vegas, NV 89031
Craig Ranch NeighborhoodEstimated Value: $367,000 - $384,000
3
Beds
2
Baths
1,294
Sq Ft
$289/Sq Ft
Est. Value
About This Home
This home is located at 25 Ruby Fountain Ave, North Las Vegas, NV 89031 and is currently estimated at $373,376, approximately $288 per square foot. 25 Ruby Fountain Ave is a home located in Clark County with nearby schools including Raul P. Elizondo Elementary School, Clifford O. Findlay Middle School, and Mojave High School.
Ownership History
Date
Name
Owned For
Owner Type
Purchase Details
Closed on
Feb 8, 2019
Sold by
Opendoor Property C Llc
Bought by
Yamasa Co Ltd
Current Estimated Value
Purchase Details
Closed on
Jan 15, 2019
Sold by
Devore Rigg Miriam
Bought by
Opendoor Property C Llc
Purchase Details
Closed on
May 26, 1998
Sold by
Thomas Sherry J and Thomas Neil J
Bought by
Devore Rigg Miriam
Home Financials for this Owner
Home Financials are based on the most recent Mortgage that was taken out on this home.
Original Mortgage
$102,500
Interest Rate
7.21%
Purchase Details
Closed on
Feb 22, 1996
Sold by
Beazer Homes Nevada Inc
Bought by
Thomas Neil J and Thomas Sherry J
Home Financials for this Owner
Home Financials are based on the most recent Mortgage that was taken out on this home.
Original Mortgage
$103,346
Interest Rate
7.1%
Mortgage Type
VA
Create a Home Valuation Report for This Property
The Home Valuation Report is an in-depth analysis detailing your home's value as well as a comparison with similar homes in the area
Home Values in the Area
Average Home Value in this Area
Purchase History
| Date | Buyer | Sale Price | Title Company |
|---|---|---|---|
| Yamasa Co Ltd | $224,500 | First American Title | |
| Opendoor Property C Llc | $222,700 | Os National Title Company | |
| Devore Rigg Miriam | -- | Old Republic Title Company | |
| Thomas Neil J | $101,500 | First American Title Co |
Source: Public Records
Mortgage History
| Date | Status | Borrower | Loan Amount |
|---|---|---|---|
| Previous Owner | Devore Rigg Miriam | $102,500 | |
| Previous Owner | Thomas Neil J | $103,346 |
Source: Public Records
Tax History Compared to Growth
Tax History
| Year | Tax Paid | Tax Assessment Tax Assessment Total Assessment is a certain percentage of the fair market value that is determined by local assessors to be the total taxable value of land and additions on the property. | Land | Improvement |
|---|---|---|---|---|
| 2025 | $1,601 | $84,749 | $31,500 | $53,249 |
| 2024 | $1,483 | $84,749 | $31,500 | $53,249 |
| 2023 | $1,483 | $80,000 | $29,400 | $50,600 |
| 2022 | $1,373 | $69,955 | $23,450 | $46,505 |
| 2021 | $1,272 | $64,565 | $20,300 | $44,265 |
| 2020 | $1,178 | $64,295 | $20,300 | $43,995 |
| 2019 | $1,104 | $59,495 | $16,100 | $43,395 |
| 2018 | $1,054 | $55,372 | $13,300 | $42,072 |
| 2017 | $1,748 | $52,124 | $11,900 | $40,224 |
| 2016 | $999 | $43,507 | $8,400 | $35,107 |
| 2015 | $996 | $34,303 | $5,950 | $28,353 |
| 2014 | $967 | $27,959 | $5,950 | $22,009 |
Source: Public Records
Map
Nearby Homes
- 5136 Stonecrop St
- 5228 Daywood St
- 5160 Eagle Way
- 5140 Eagle Way
- 5128 Eagle Way
- 113 Chino Ave
- 5052 Eagle Way
- 5048 Eagle Way
- 5044 Eagle Way
- 5036 Eagle Way
- 5029 Corbindale St
- 5025 Corbindale St
- 5021 Corbindale St
- 5017 Corbindale St
- 4925 Goldfield St
- Residence 2119 Plan at Bravado
- Residence 1943 Plan at Bravado
- Residence 1792 Plan at Bravado
- 17 Deseo Ct
- 5208 Ponderosa Heights St
- 21 Ruby Fountain Ave
- 29 Ruby Fountain Ave
- 20 Honey Locust Dr
- 28 Honey Locust Dr
- 5237 French Lavender St
- 5238 Acacia Grove St
- 33 Ruby Fountain Ave
- 32 Honey Locust Dr
- 5228 French Lavender St
- 5224 French Lavender St
- 5241 French Lavender St
- 5242 Acacia Grove St
- 5232 French Lavender St
- 36 Honey Locust Dr
- 5220 French Lavender St
- 5235 Acacia Grove St
- 5236 French Lavender St
- 23 Honey Locust Dr
- 5245 French Lavender St