
Seller's Agent in 2018
Scott White
eXp Realty
(508) 208-9173
1 in this area
8 Total Sales
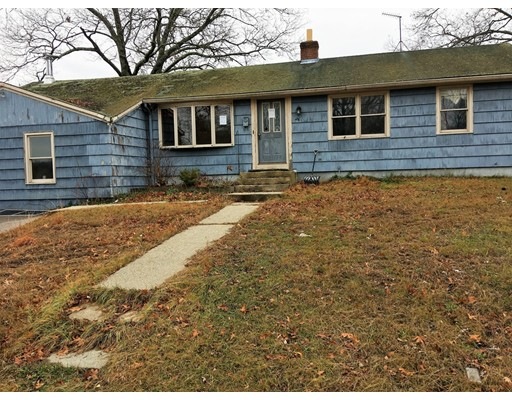
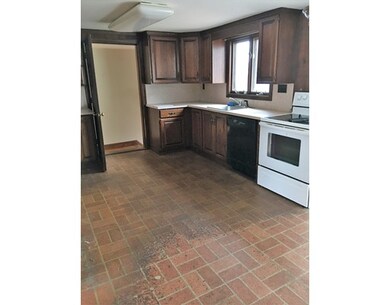
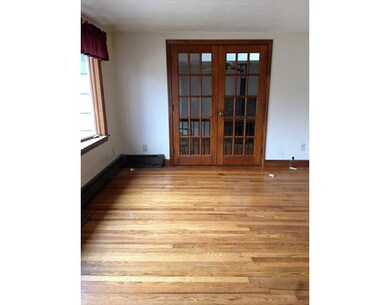
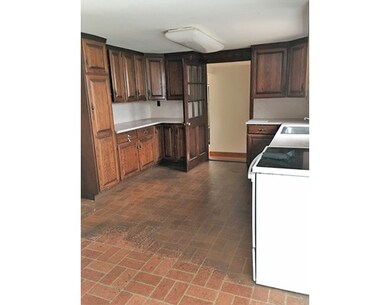
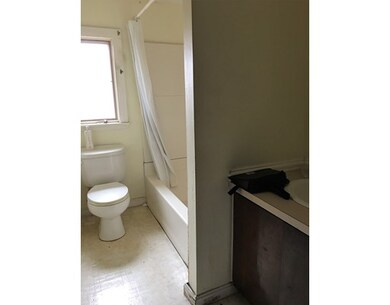
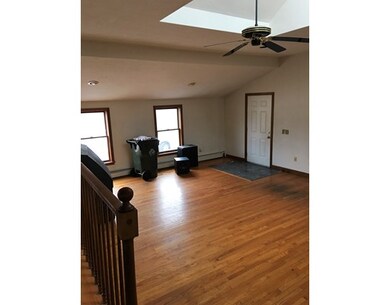
Ranch with four bedrooms with carpeting, large family room with fireplace and hardwood floor. ,Hardwood floors in livingroom with full bath in master bedroom- two full bathrooms. Needs TLC, bank owned requiring third party approval.
| Date | Type | Sale Price | Title Company |
|---|---|---|---|
| Warranty Deed | $185,100 | -- | |
| Foreclosure Deed | $184,261 | -- |
| Date | Status | Loan Amount | Loan Type |
|---|---|---|---|
| Open | $215,000 | New Conventional | |
| Previous Owner | $203,500 | No Value Available | |
| Previous Owner | $15,000 | No Value Available | |
| Previous Owner | $163,000 | No Value Available | |
| Previous Owner | $126,000 | No Value Available | |
| Previous Owner | $97,500 | No Value Available |
| Date | Event | Price | Change | Sq Ft Price |
|---|---|---|---|---|
| 01/19/2018 01/19/18 | Sold | $330,000 | -2.9% | $149 / Sq Ft |
| 12/12/2017 12/12/17 | Pending | -- | -- | -- |
| 12/08/2017 12/08/17 | Price Changed | $339,900 | -2.9% | $153 / Sq Ft |
| 11/05/2017 11/05/17 | Price Changed | $349,900 | -2.8% | $158 / Sq Ft |
| 10/26/2017 10/26/17 | For Sale | $359,900 | +98.3% | $162 / Sq Ft |
| 08/03/2017 08/03/17 | Sold | $181,500 | -1.0% | $100 / Sq Ft |
| 05/22/2017 05/22/17 | Pending | -- | -- | -- |
| 05/04/2017 05/04/17 | Price Changed | $183,400 | 0.0% | $101 / Sq Ft |
| 05/04/2017 05/04/17 | For Sale | $183,400 | +1.0% | $101 / Sq Ft |
| 05/01/2017 05/01/17 | Off Market | $181,500 | -- | -- |
| 01/09/2017 01/09/17 | For Sale | $203,300 | -- | $112 / Sq Ft |
| Year | Tax Paid | Tax Assessment Tax Assessment Total Assessment is a certain percentage of the fair market value that is determined by local assessors to be the total taxable value of land and additions on the property. | Land | Improvement |
|---|---|---|---|---|
| 2025 | $5,363 | $427,000 | $165,200 | $261,800 |
| 2024 | $5,102 | $396,700 | $150,800 | $245,900 |
| 2023 | $4,919 | $376,900 | $143,700 | $233,200 |
| 2022 | $4,791 | $340,300 | $119,800 | $220,500 |
| 2021 | $4,628 | $321,200 | $119,800 | $201,400 |
| 2020 | $4,398 | $309,300 | $119,800 | $189,500 |
| 2019 | $4,296 | $302,300 | $119,800 | $182,500 |
| 2018 | $3,396 | $235,700 | $115,200 | $120,500 |
| 2017 | $3,323 | $231,700 | $115,200 | $116,500 |
| 2016 | $3,158 | $221,000 | $113,200 | $107,800 |
| 2015 | $3,030 | $212,600 | $108,900 | $103,700 |
| 2014 | $3,036 | $207,100 | $106,400 | $100,700 |
Seller's Agent in 2018
Scott White
eXp Realty
(508) 208-9173
1 in this area
8 Total Sales
K
Buyer's Agent in 2018
Kathi Sullivan
Berkshire Hathaway HomeServices Evolution Properties
Seller's Agent in 2017
Richard Phipps
CFS Realty
(617) 963-4897
7 Total Sales
Source: MLS Property Information Network (MLS PIN)
MLS Number: 72107367
APN: BELL-000064-000034
Disclaimer: Certain information contained herein is derived from information provided by parties other than Homes.com. All information provided is deemed reliable, but is not guaranteed to be accurate and should be independently verified.
![]() The property listing data and information, or the Images, set forth herein were provided to MLS Property Information Network, Inc. from third party sources, including sellers, lessors and public records, and were compiled by MLS Property Information Network, Inc. The property listing data and information, and the Images, are for the personal, non-commercial use of consumers having a good faith interest in purchasing or leasing listed properties of the type displayed to them and may not be used for any purpose other than to identify prospective properties which such consumers may have a good faith interest in purchasing or leasing. MLS Property Information Network, Inc. and its subscribers disclaim any and all representations and warranties as to the accuracy of the property listing data and information, or as to the accuracy of any of the Images, set forth herein.
The property listing data and information, or the Images, set forth herein were provided to MLS Property Information Network, Inc. from third party sources, including sellers, lessors and public records, and were compiled by MLS Property Information Network, Inc. The property listing data and information, and the Images, are for the personal, non-commercial use of consumers having a good faith interest in purchasing or leasing listed properties of the type displayed to them and may not be used for any purpose other than to identify prospective properties which such consumers may have a good faith interest in purchasing or leasing. MLS Property Information Network, Inc. and its subscribers disclaim any and all representations and warranties as to the accuracy of the property listing data and information, or as to the accuracy of any of the Images, set forth herein.