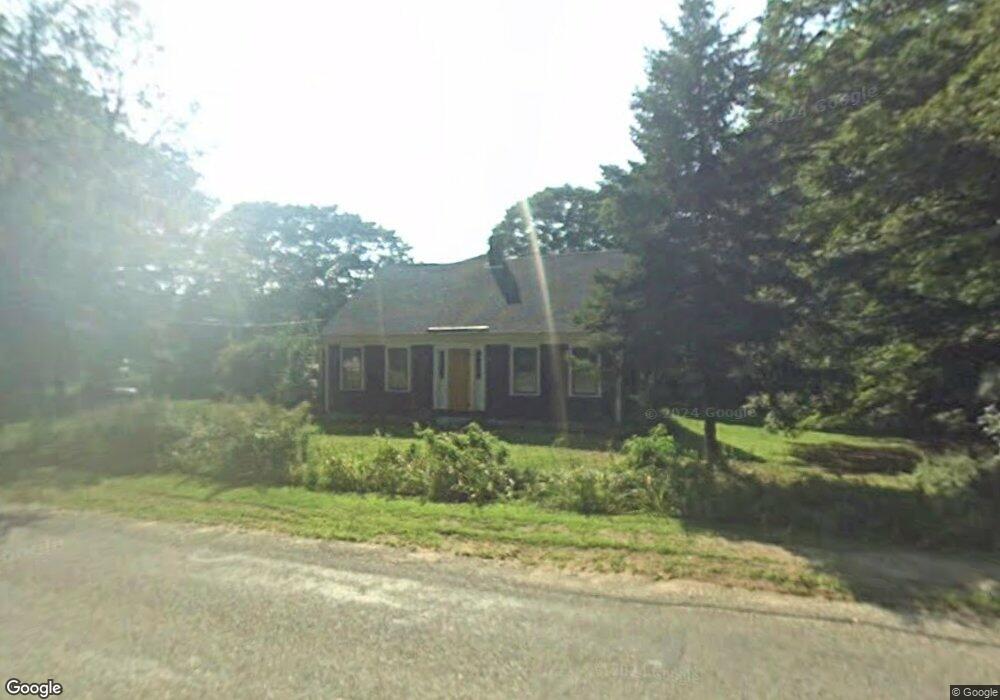
25 S Main St Berkley, MA 02779
Estimated Value: $584,000 - $789,000
3
Beds
2
Baths
2,426
Sq Ft
$279/Sq Ft
Est. Value
About This Home
This home is located at 25 S Main St, Berkley, MA 02779 and is currently estimated at $675,854, approximately $278 per square foot. 25 S Main St is a home located in Bristol County with nearby schools including Berkley Community School and Our Lady of Lourdes School.
Ownership History
Date
Name
Owned For
Owner Type
Purchase Details
Closed on
Dec 30, 2003
Sold by
25 South Main Street R and Rowland Sandra Dawn
Bought by
Shavandy Parviz
Current Estimated Value
Purchase Details
Closed on
Jul 24, 1997
Sold by
Bovie Warren W and Bovie Karen M
Bought by
S Main St 25 Rt and Rowland Sandra Dawn
Home Financials for this Owner
Home Financials are based on the most recent Mortgage that was taken out on this home.
Original Mortgage
$153,000
Interest Rate
7.7%
Mortgage Type
Purchase Money Mortgage
Create a Home Valuation Report for This Property
The Home Valuation Report is an in-depth analysis detailing your home's value as well as a comparison with similar homes in the area
Purchase History
| Date | Buyer | Sale Price | Title Company |
|---|---|---|---|
| Shavandy Parviz | -- | -- | |
| S Main St 25 Rt | $170,000 | -- |
Source: Public Records
Mortgage History
| Date | Status | Borrower | Loan Amount |
|---|---|---|---|
| Previous Owner | S Main St 25 Rt | $153,000 | |
| Previous Owner | S Main St 25 Rt | $100,000 | |
| Previous Owner | S Main St 25 Rt | $100,000 |
Source: Public Records
Tax History Compared to Growth
Tax History
| Year | Tax Paid | Tax Assessment Tax Assessment Total Assessment is a certain percentage of the fair market value that is determined by local assessors to be the total taxable value of land and additions on the property. | Land | Improvement |
|---|---|---|---|---|
| 2025 | $50 | $419,900 | $159,800 | $260,100 |
| 2024 | $4,796 | $385,200 | $137,800 | $247,400 |
| 2023 | $4,583 | $346,700 | $137,800 | $208,900 |
| 2022 | $4,439 | $322,800 | $120,000 | $202,800 |
| 2021 | $3,486 | $302,800 | $114,300 | $188,500 |
| 2020 | $4,174 | $287,300 | $101,300 | $186,000 |
| 2019 | $2,534 | $276,000 | $101,300 | $174,700 |
| 2018 | $2,981 | $262,000 | $97,400 | $164,600 |
| 2017 | $3,624 | $253,400 | $109,000 | $144,400 |
| 2016 | $3,536 | $238,300 | $109,000 | $129,300 |
| 2015 | $3,297 | $237,000 | $109,000 | $128,000 |
| 2014 | $3,156 | $246,400 | $118,200 | $128,200 |
Source: Public Records
Map
Nearby Homes