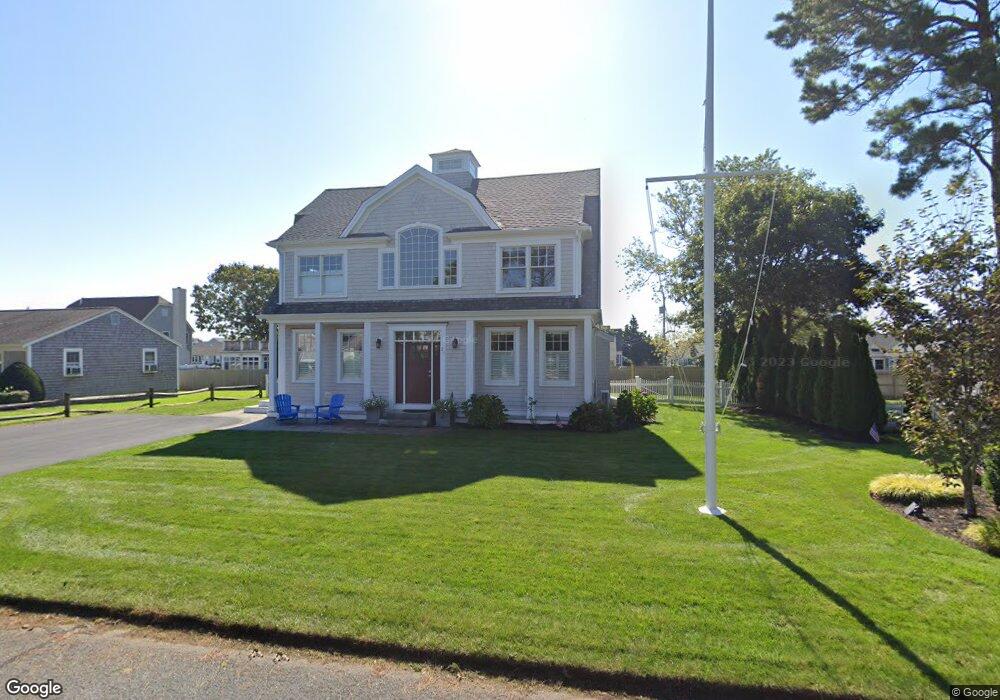
25 Santucket Rd West Dennis, MA 02670
West Dennis NeighborhoodEstimated Value: $1,253,000 - $1,942,000
2
Beds
1
Bath
800
Sq Ft
$2,057/Sq Ft
Est. Value
About This Home
This home is located at 25 Santucket Rd, West Dennis, MA 02670 and is currently estimated at $1,645,268, approximately $2,056 per square foot. 25 Santucket Rd is a home located in Barnstable County with nearby schools including Dennis-Yarmouth Regional High School and St. Pius X. School.
Ownership History
Date
Name
Owned For
Owner Type
Purchase Details
Closed on
Jul 14, 2015
Sold by
Edwards Richard P and Edwards Paula A
Bought by
Richard P Edwards T
Current Estimated Value
Purchase Details
Closed on
Sep 19, 2003
Sold by
Oslin Susan T
Bought by
Edwards Richard P and Edwards Paula A
Home Financials for this Owner
Home Financials are based on the most recent Mortgage that was taken out on this home.
Original Mortgage
$190,000
Interest Rate
6.31%
Mortgage Type
Purchase Money Mortgage
Create a Home Valuation Report for This Property
The Home Valuation Report is an in-depth analysis detailing your home's value as well as a comparison with similar homes in the area
Home Values in the Area
Average Home Value in this Area
Purchase History
| Date | Buyer | Sale Price | Title Company |
|---|---|---|---|
| Richard P Edwards T | -- | -- | |
| Edwards Richard P | $275,000 | -- |
Source: Public Records
Mortgage History
| Date | Status | Borrower | Loan Amount |
|---|---|---|---|
| Previous Owner | Edwards Richard P | $190,000 |
Source: Public Records
Tax History Compared to Growth
Tax History
| Year | Tax Paid | Tax Assessment Tax Assessment Total Assessment is a certain percentage of the fair market value that is determined by local assessors to be the total taxable value of land and additions on the property. | Land | Improvement |
|---|---|---|---|---|
| 2025 | $5,800 | $1,339,500 | $386,600 | $952,900 |
| 2024 | $5,797 | $1,320,400 | $309,800 | $1,010,600 |
| 2023 | $5,653 | $1,210,400 | $281,700 | $928,700 |
| 2022 | $5,316 | $949,300 | $253,700 | $695,600 |
| 2021 | $5,133 | $851,300 | $248,800 | $602,500 |
| 2020 | $3,209 | $820,700 | $276,400 | $544,300 |
| 2019 | $3,055 | $807,500 | $271,000 | $536,500 |
| 2018 | $4,406 | $695,000 | $232,200 | $462,800 |
| 2017 | $2,067 | $336,100 | $232,200 | $103,900 |
| 2016 | $2,129 | $326,100 | $237,300 | $88,800 |
| 2015 | $2,087 | $326,100 | $237,300 | $88,800 |
| 2014 | $1,940 | $305,500 | $216,700 | $88,800 |
Source: Public Records
Map
Nearby Homes
- 2 Rita Mary Way
- 14 Schoolhouse Ln
- 209 Main St Unit 3
- 209 Main St Unit 6
- 209 Main St Unit 1
- 209 Main St Unit 2
- 209 Main St Unit 4
- 209 Main St Unit 5
- 178 School St
- 23 Doric Ave
- 308 Old Main St
- 181 Pleasant St
- 401 Main St Unit 201
- 401 Main St Unit 101
- 45 Seth Ln
- 40 Kelley Rd
- 467 Main St
- 29 Bass River Rd
- 22 Powhatan Rd
- 18 Turner Ln