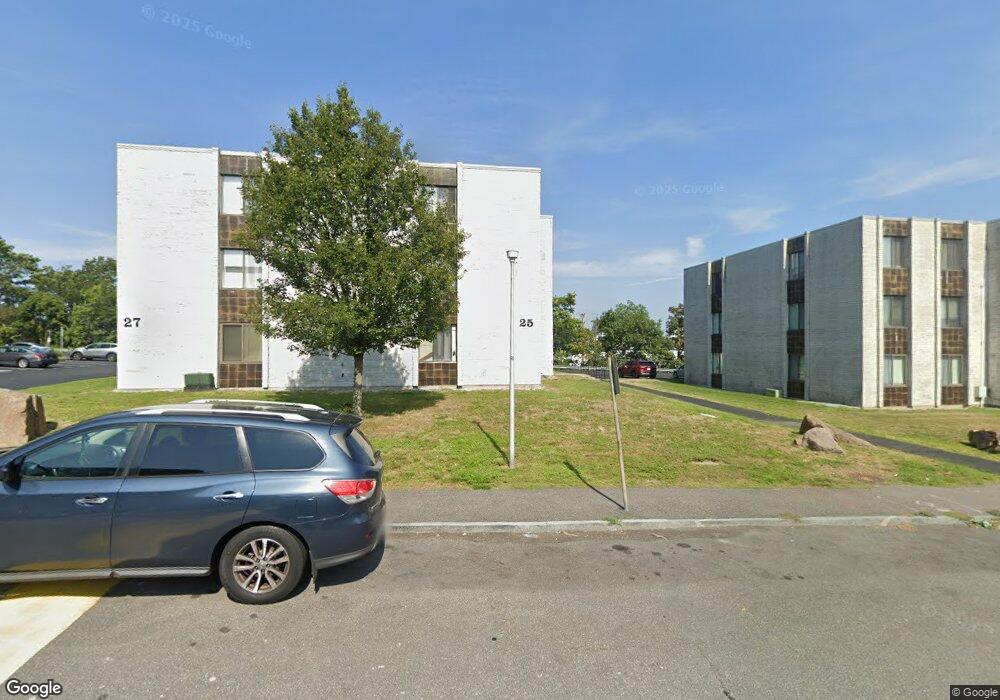
25 Skyline Dr Unit 9 Braintree, MA 02184
East Braintree NeighborhoodEstimated Value: $386,000 - $416,000
2
Beds
2
Baths
1,103
Sq Ft
$366/Sq Ft
Est. Value
About This Home
This home is located at 25 Skyline Dr Unit 9, Braintree, MA 02184 and is currently estimated at $403,667, approximately $365 per square foot. 25 Skyline Dr Unit 9 is a home located in Norfolk County with nearby schools including Braintree High School, Noble Academy, and Sacred Heart Elementary School.
Ownership History
Date
Name
Owned For
Owner Type
Purchase Details
Closed on
Sep 22, 2016
Sold by
Xiong-Liang Wei and Mui Chee M
Bought by
Liang Karen
Current Estimated Value
Purchase Details
Closed on
May 9, 2007
Sold by
Lin Wan Z
Bought by
Mui Chee M and Liang Wei L
Home Financials for this Owner
Home Financials are based on the most recent Mortgage that was taken out on this home.
Original Mortgage
$118,000
Interest Rate
6.21%
Mortgage Type
Purchase Money Mortgage
Purchase Details
Closed on
Dec 31, 2001
Sold by
Huang Guangyun
Bought by
Lin Wan Z
Purchase Details
Closed on
Mar 3, 1998
Sold by
Ehrstein Judith
Bought by
Huang Guangyun
Home Financials for this Owner
Home Financials are based on the most recent Mortgage that was taken out on this home.
Original Mortgage
$60,000
Interest Rate
6.85%
Mortgage Type
Purchase Money Mortgage
Purchase Details
Closed on
Sep 27, 1996
Sold by
Chin Robert Kl and Chin Annie L
Bought by
Ehrstein Judith
Create a Home Valuation Report for This Property
The Home Valuation Report is an in-depth analysis detailing your home's value as well as a comparison with similar homes in the area
Home Values in the Area
Average Home Value in this Area
Purchase History
| Date | Buyer | Sale Price | Title Company |
|---|---|---|---|
| Liang Karen | -- | -- | |
| Mui Chee M | $208,000 | -- | |
| Lin Wan Z | $83,000 | -- | |
| Huang Guangyun | $82,700 | -- | |
| Ehrstein Judith | $75,000 | -- |
Source: Public Records
Mortgage History
| Date | Status | Borrower | Loan Amount |
|---|---|---|---|
| Previous Owner | Mui Chee M | $118,000 | |
| Previous Owner | Ehrstein Judith | $131,600 | |
| Previous Owner | Ehrstein Judith | $60,000 |
Source: Public Records
Tax History Compared to Growth
Tax History
| Year | Tax Paid | Tax Assessment Tax Assessment Total Assessment is a certain percentage of the fair market value that is determined by local assessors to be the total taxable value of land and additions on the property. | Land | Improvement |
|---|---|---|---|---|
| 2025 | $3,693 | $370,000 | $0 | $370,000 |
| 2024 | $2,823 | $297,800 | $0 | $297,800 |
| 2023 | $2,851 | $292,100 | $0 | $292,100 |
| 2022 | $2,789 | $280,300 | $0 | $280,300 |
| 2021 | $2,789 | $280,300 | $0 | $280,300 |
| 2020 | $2,551 | $258,700 | $0 | $258,700 |
| 2019 | $2,205 | $218,500 | $0 | $218,500 |
| 2018 | $2,326 | $220,700 | $0 | $220,700 |
| 2017 | $2,388 | $222,300 | $0 | $222,300 |
| 2016 | $1,951 | $177,700 | $0 | $177,700 |
| 2015 | $1,900 | $171,600 | $0 | $171,600 |
| 2014 | $1,767 | $154,700 | $0 | $154,700 |
Source: Public Records
Map
Nearby Homes
- 30 Skyline Dr Unit 6
- 10 Skyline Dr Unit 5
- 25 W Howard St Unit D2
- 15 Bower Rd Unit B5
- 15 Bower Rd Unit A2
- 15 Bower Rd Unit B2
- 9 Hillside Ave
- 312 Shaw St
- 159 Hobart St
- 141 Hobart St
- 67 Somerville Ave
- 1 Pantano St
- 200 Falls Blvd Unit C308
- 25 John Paul Cir
- 74 Magnolia St
- 934 Southern Artery Unit 109
- 41 Broadway
- 125 Allen St Unit A
- 39 Morrison Rd
- 48 Conrad St
- 25 Skyline Dr Unit 10
- 25 Skyline Dr Unit 6
- 25 Skyline Dr Unit 5
- 25 Skyline Dr Unit 2
- 25 Skyline Dr Unit 1
- 25 Skyline Dr Unit 6
- 27 Skyline Dr Unit 12
- 27 Skyline Dr Unit 11
- 27 Skyline Dr Unit 8
- 27 Skyline Dr Unit 7
- 27 Skyline Dr Unit 4
- 27 Skyline Dr Unit 3
- #3 Hickory Road Extention
- 15 Skyline Dr Unit 10
- 15 Skyline Dr Unit 9
- 15 Skyline Dr Unit 6
- 15 Skyline Dr Unit 5
- 15 Skyline Dr Unit 2
- 15 Skyline Dr Unit 1
- 15 Skyline Dr Unit 999