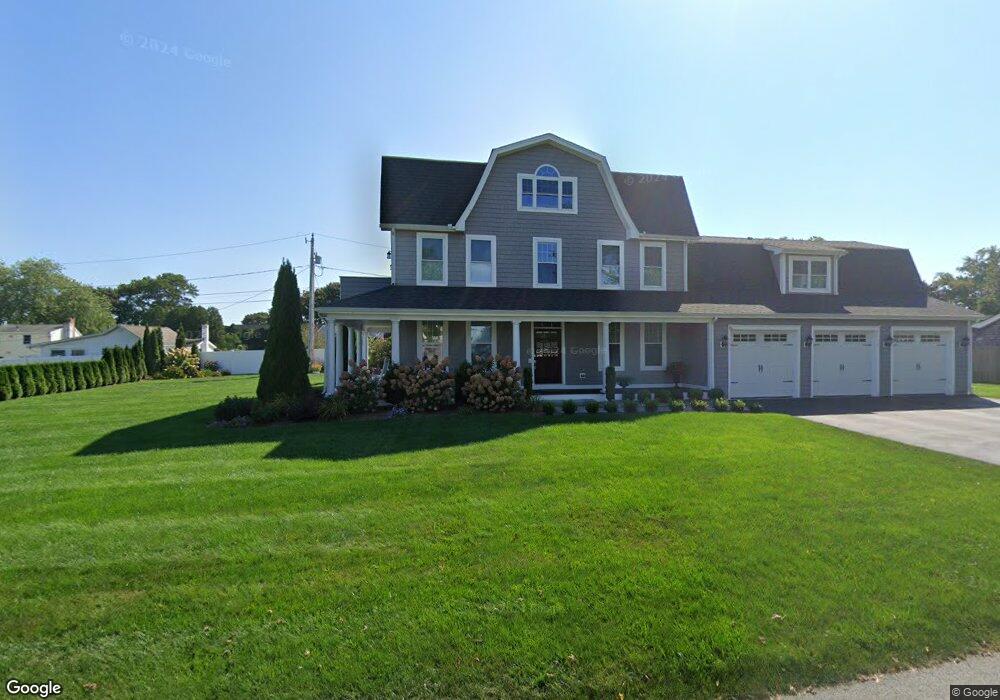
25 Sound View Ave-2 Old Saybrook, CT 06475
Estimated Value: $1,549,000 - $1,797,952
2
Beds
1
Bath
4,108
Sq Ft
$414/Sq Ft
Est. Value
About This Home
This home is located at 25 Sound View Ave-2, Old Saybrook, CT 06475 and is currently estimated at $1,700,317, approximately $413 per square foot. 25 Sound View Ave-2 is a home located in Middlesex County with nearby schools including Kathleen E. Goodwin School, Old Saybrook Middle School, and Old Saybrook Senior High School.
Ownership History
Date
Name
Owned For
Owner Type
Purchase Details
Closed on
Oct 9, 2019
Sold by
311 Llc
Bought by
Robles Sharon A and Robles Angel M
Current Estimated Value
Purchase Details
Closed on
Jan 11, 2018
Sold by
Malazzi Andrew
Bought by
311 Llc
Purchase Details
Closed on
Mar 13, 2017
Sold by
Karalexis Andrea J
Bought by
Wells Fargo Bank Na
Purchase Details
Closed on
Aug 30, 2013
Sold by
Kirkwood Thomas P and Kirkwood Patricia E
Bought by
Karalexis Andrea J and Kirkwood Richard H
Home Financials for this Owner
Home Financials are based on the most recent Mortgage that was taken out on this home.
Original Mortgage
$240,000
Interest Rate
4.4%
Mortgage Type
New Conventional
Create a Home Valuation Report for This Property
The Home Valuation Report is an in-depth analysis detailing your home's value as well as a comparison with similar homes in the area
Home Values in the Area
Average Home Value in this Area
Purchase History
| Date | Buyer | Sale Price | Title Company |
|---|---|---|---|
| Robles Sharon A | $1,055,000 | -- | |
| Robles Sharon A | $1,055,000 | -- | |
| 311 Llc | -- | -- | |
| Malazzi Andrew | $241,777 | -- | |
| Wilmington Svgs Fund S | -- | -- | |
| Wells Fargo Bank Na | -- | -- | |
| Karalexis Andrea J | $310,000 | -- | |
| Wilmington Svgs Fund S | -- | -- | |
| Wells Fargo Bank Na | -- | -- | |
| Karalexis Andrea J | $310,000 | -- |
Source: Public Records
Mortgage History
| Date | Status | Borrower | Loan Amount |
|---|---|---|---|
| Previous Owner | Karalexis Andrea J | $240,000 |
Source: Public Records
Tax History Compared to Growth
Tax History
| Year | Tax Paid | Tax Assessment Tax Assessment Total Assessment is a certain percentage of the fair market value that is determined by local assessors to be the total taxable value of land and additions on the property. | Land | Improvement |
|---|---|---|---|---|
| 2025 | $15,347 | $990,100 | $213,400 | $776,700 |
| 2024 | $15,050 | $990,100 | $213,400 | $776,700 |
| 2023 | $13,397 | $655,100 | $145,400 | $509,700 |
| 2022 | $13,154 | $655,100 | $145,400 | $509,700 |
| 2021 | $13,135 | $655,100 | $145,400 | $509,700 |
| 2020 | $13,135 | $655,100 | $145,400 | $509,700 |
| 2019 | $2,872 | $145,400 | $145,400 | $0 |
| 2018 | $4,459 | $227,500 | $145,400 | $82,100 |
| 2017 | $4,473 | $227,500 | $145,400 | $82,100 |
| 2016 | $4,382 | $227,500 | $145,400 | $82,100 |
| 2015 | $4,279 | $227,500 | $145,400 | $82,100 |
| 2014 | $4,945 | $267,300 | $145,400 | $121,900 |
Source: Public Records
Map
Nearby Homes