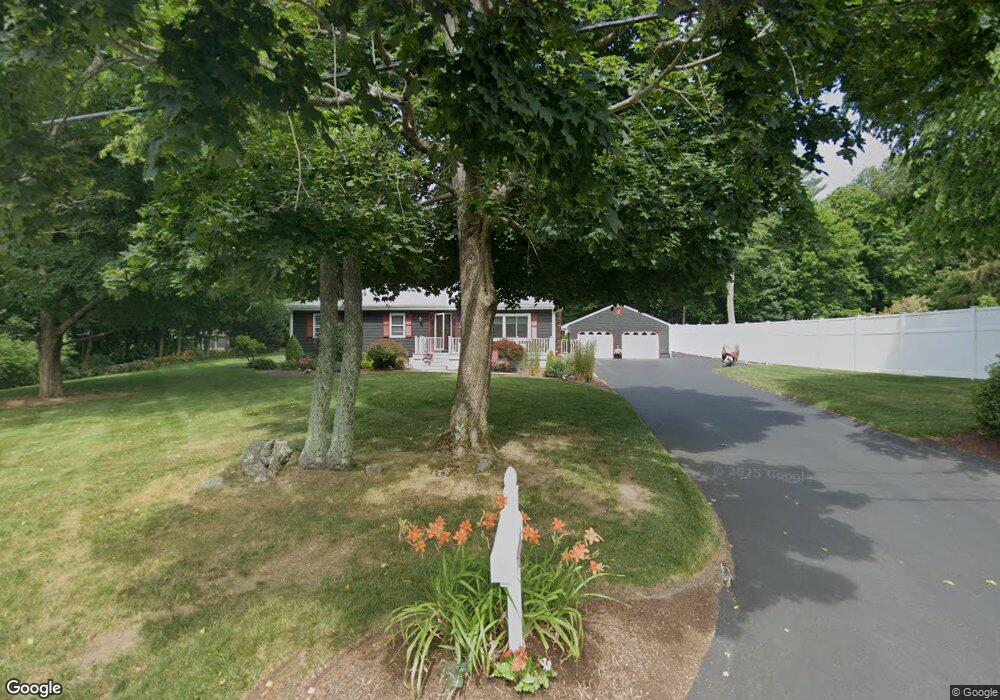
25 South St East Bridgewater, MA 02333
Estimated Value: $567,481 - $687,000
3
Beds
3
Baths
1,248
Sq Ft
$495/Sq Ft
Est. Value
About This Home
This home is located at 25 South St, East Bridgewater, MA 02333 and is currently estimated at $617,620, approximately $494 per square foot. 25 South St is a home located in Plymouth County with nearby schools including Central Elementary School, Gordon W Mitchell Middle School, and East Bridgewater Jr./Sr. High School.
Ownership History
Date
Name
Owned For
Owner Type
Purchase Details
Closed on
Aug 17, 1989
Sold by
Dechaves Jose
Bought by
Cepero Jaime
Current Estimated Value
Create a Home Valuation Report for This Property
The Home Valuation Report is an in-depth analysis detailing your home's value as well as a comparison with similar homes in the area
Home Values in the Area
Average Home Value in this Area
Purchase History
| Date | Buyer | Sale Price | Title Company |
|---|---|---|---|
| Cepero Jaime | $184,000 | -- |
Source: Public Records
Mortgage History
| Date | Status | Borrower | Loan Amount |
|---|---|---|---|
| Open | Cepero Jaime | $100,000 | |
| Closed | Cepero Jaime | $35,000 | |
| Closed | Cepero Jaime | $151,200 |
Source: Public Records
Tax History Compared to Growth
Tax History
| Year | Tax Paid | Tax Assessment Tax Assessment Total Assessment is a certain percentage of the fair market value that is determined by local assessors to be the total taxable value of land and additions on the property. | Land | Improvement |
|---|---|---|---|---|
| 2025 | $6,925 | $506,600 | $196,000 | $310,600 |
| 2024 | $6,744 | $487,300 | $188,500 | $298,800 |
| 2023 | $6,630 | $458,800 | $188,500 | $270,300 |
| 2022 | $6,616 | $424,100 | $171,400 | $252,700 |
| 2021 | $4,211 | $377,500 | $164,700 | $212,800 |
| 2020 | $6,287 | $363,600 | $158,500 | $205,100 |
| 2019 | $6,146 | $350,000 | $151,500 | $198,500 |
| 2018 | $4,344 | $326,000 | $151,500 | $174,500 |
| 2017 | $1,202 | $310,800 | $144,500 | $166,300 |
| 2016 | $5,530 | $304,500 | $144,500 | $160,000 |
| 2015 | $5,337 | $300,500 | $143,500 | $157,000 |
| 2014 | $5,098 | $293,500 | $140,500 | $153,000 |
Source: Public Records
Map
Nearby Homes
- 121 South St
- 587 Bridge St
- 10 Eliab Latham Way
- 261 Plymouth St
- 28 Brookbend Way E
- 78 Crystal Water Dr
- 182 Crystal Water Dr Unit 182
- 590 Bedford St
- 217 Crystal Water Dr
- 0 Three Rivers Dr
- 386 Bedford St
- 391 Bedford St
- 52 Cottage St
- 71 Stonegate Dr
- 94 Pond St
- 71 Church St
- 23 Stone Meadow Dr
- 827 High St
- 81 Arrowhead Dr
- 114 Plain St
- 617 Plymouth St
- 45 South St
- 603 Plymouth St
- 622 Plymouth St
- 622 Plymouth St Unit 2
- 50 Careys Landing
- 97 South St
- 587 Plymouth St
- 600 Plymouth St
- 40 Careys Landing
- 111 South St
- 650 Plymouth St Unit 11
- 650 Plymouth St
- 55 Careys Landing
- 584 Plymouth St
- 30 Careys Landing
- 555 Plymouth St
- 45 Careys Landing
- 680 Plymouth St
- 115 South St