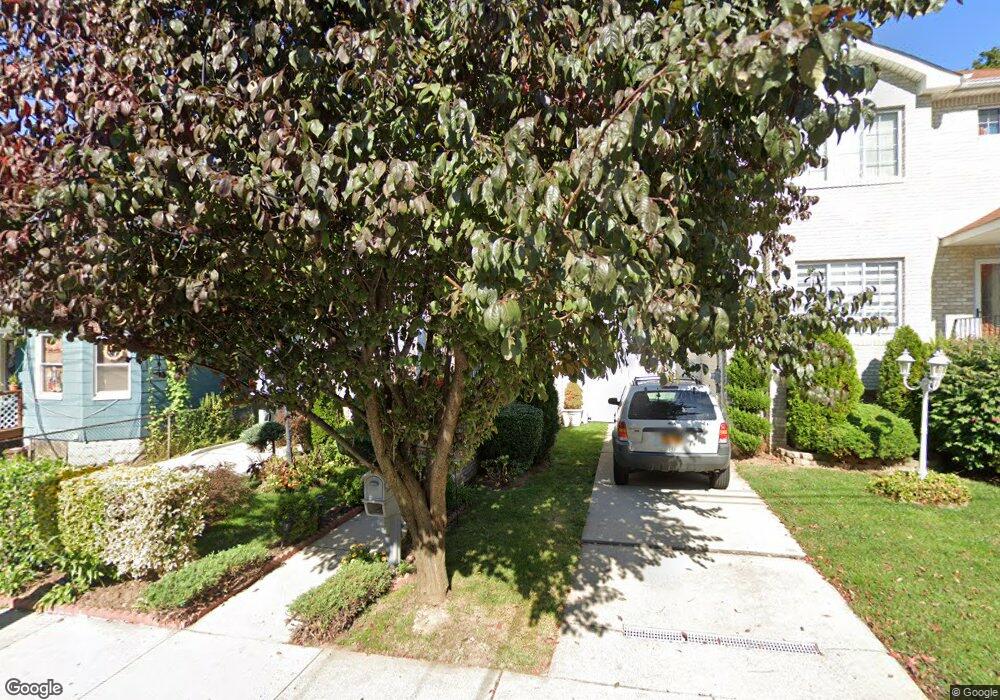
25 South St Staten Island, NY 10310
West Brighton NeighborhoodEstimated Value: $694,681 - $831,000
--
Bed
4
Baths
1,878
Sq Ft
$402/Sq Ft
Est. Value
About This Home
This home is located at 25 South St, Staten Island, NY 10310 and is currently estimated at $754,670, approximately $401 per square foot. 25 South St is a home located in Richmond County with nearby schools including P.S. 45 John Tyler, Intermediate School 27, and Susan E Wagner High School.
Ownership History
Date
Name
Owned For
Owner Type
Purchase Details
Closed on
Dec 21, 2006
Sold by
Horsford Andrea and Fraser Mark
Bought by
Horsford Andrea and Dumas Simon
Current Estimated Value
Home Financials for this Owner
Home Financials are based on the most recent Mortgage that was taken out on this home.
Original Mortgage
$484,500
Outstanding Balance
$320,219
Interest Rate
8.3%
Mortgage Type
New Conventional
Estimated Equity
$434,451
Purchase Details
Closed on
Dec 16, 2005
Sold by
Gns Development Corp
Bought by
Horsford Andrea and Fraser Mark
Home Financials for this Owner
Home Financials are based on the most recent Mortgage that was taken out on this home.
Original Mortgage
$91,160
Interest Rate
6.39%
Mortgage Type
Fannie Mae Freddie Mac
Create a Home Valuation Report for This Property
The Home Valuation Report is an in-depth analysis detailing your home's value as well as a comparison with similar homes in the area
Home Values in the Area
Average Home Value in this Area
Purchase History
| Date | Buyer | Sale Price | Title Company |
|---|---|---|---|
| Horsford Andrea | -- | First Amer Title Ins Co Ny | |
| Horsford Andrea | $455,800 | The Judicial Title Insurance |
Source: Public Records
Mortgage History
| Date | Status | Borrower | Loan Amount |
|---|---|---|---|
| Open | Horsford Andrea | $484,500 | |
| Previous Owner | Horsford Andrea | $91,160 |
Source: Public Records
Tax History Compared to Growth
Tax History
| Year | Tax Paid | Tax Assessment Tax Assessment Total Assessment is a certain percentage of the fair market value that is determined by local assessors to be the total taxable value of land and additions on the property. | Land | Improvement |
|---|---|---|---|---|
| 2025 | $5,672 | $44,460 | $8,887 | $35,573 |
| 2024 | $5,672 | $39,300 | $9,485 | $29,815 |
| 2023 | $5,410 | $26,640 | $9,608 | $17,032 |
| 2022 | $5,318 | $29,760 | $13,200 | $16,560 |
| 2021 | $5,565 | $31,380 | $13,200 | $18,180 |
| 2020 | $5,280 | $29,580 | $13,200 | $16,380 |
| 2019 | $4,923 | $31,200 | $13,200 | $18,000 |
| 2018 | $4,525 | $22,200 | $13,200 | $9,000 |
| 2017 | $4,967 | $24,367 | $12,643 | $11,724 |
| 2016 | $4,595 | $22,988 | $12,456 | $10,532 |
| 2015 | $3,926 | $21,687 | $12,991 | $8,696 |
| 2014 | $3,926 | $20,460 | $14,700 | $5,760 |
Source: Public Records
Map
Nearby Homes
- 1001 Castleton Ave
- 56 South St
- 305 Broadway
- 943 Castleton Ave
- 361 Broadway
- 46 Winegar Ln
- 1064 Castleton Ave
- 207 N Burgher Ave
- 386 N Burgher Ave
- 698 Henderson Ave
- 718 Henderson Ave
- 555 Delafield Ave
- 331 Oakland Ave
- 335 Oakland Ave
- 699 Henderson Ave
- 46 Elizabeth St
- 77 Barker St
- 432 Pelton Ave
- 163 Bement Ave
- 57 Barker St