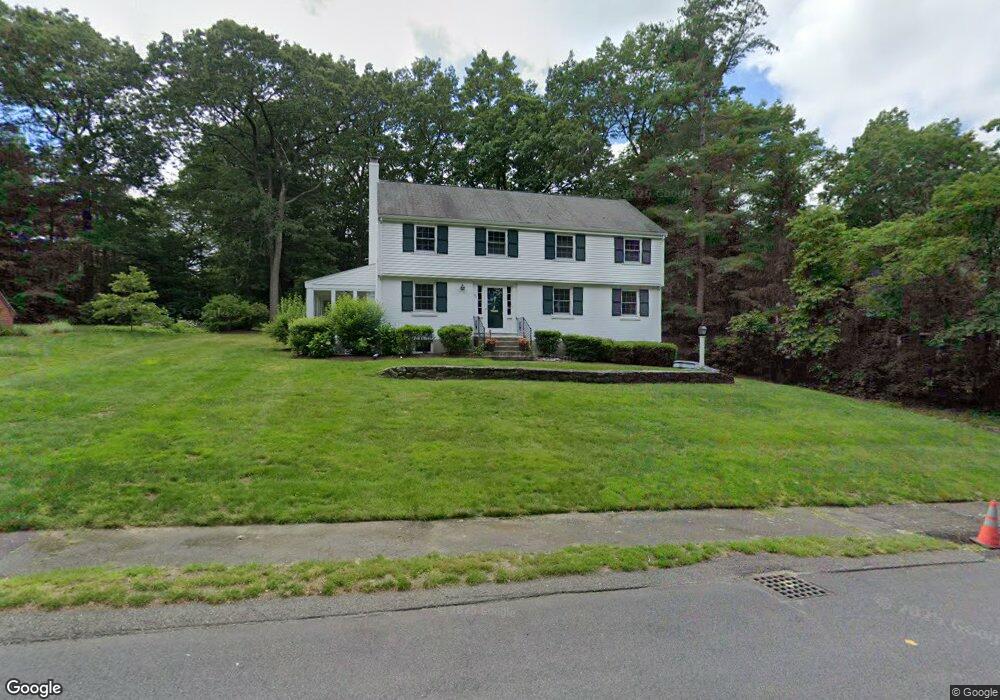
25 Sterling Rd Wellesley, MA 02482
Dana Hall NeighborhoodEstimated Value: $1,873,286 - $2,177,000
4
Beds
3
Baths
2,058
Sq Ft
$964/Sq Ft
Est. Value
About This Home
This home is located at 25 Sterling Rd, Wellesley, MA 02482 and is currently estimated at $1,983,822, approximately $963 per square foot. 25 Sterling Rd is a home located in Norfolk County with nearby schools including Hunnewell Elementary School, Wellesley Middle School, and Wellesley Sr High School.
Ownership History
Date
Name
Owned For
Owner Type
Purchase Details
Closed on
Nov 19, 2018
Sold by
Fillo Joseph F and Hernett-Fillo Mary E
Bought by
Fillo Rt
Current Estimated Value
Purchase Details
Closed on
Apr 23, 1987
Sold by
Cannon Rosamond C
Bought by
Fillo Joseph F
Create a Home Valuation Report for This Property
The Home Valuation Report is an in-depth analysis detailing your home's value as well as a comparison with similar homes in the area
Home Values in the Area
Average Home Value in this Area
Purchase History
| Date | Buyer | Sale Price | Title Company |
|---|---|---|---|
| Fillo Rt | -- | -- | |
| Fillo Joseph F | $385,000 | -- |
Source: Public Records
Mortgage History
| Date | Status | Borrower | Loan Amount |
|---|---|---|---|
| Previous Owner | Fillo Joseph F | $570,000 | |
| Previous Owner | Fillo Joseph F | $134,000 |
Source: Public Records
Tax History
| Year | Tax Paid | Tax Assessment Tax Assessment Total Assessment is a certain percentage of the fair market value that is determined by local assessors to be the total taxable value of land and additions on the property. | Land | Improvement |
|---|---|---|---|---|
| 2025 | $15,770 | $1,534,000 | $1,077,000 | $457,000 |
| 2024 | $15,303 | $1,470,000 | $1,028,000 | $442,000 |
| 2023 | $15,400 | $1,345,000 | $940,000 | $405,000 |
| 2022 | $13,771 | $1,179,000 | $777,000 | $402,000 |
| 2021 | $13,853 | $1,179,000 | $777,000 | $402,000 |
| 2020 | $13,629 | $1,179,000 | $777,000 | $402,000 |
| 2019 | $13,641 | $1,179,000 | $777,000 | $402,000 |
| 2018 | $12,058 | $1,009,000 | $735,000 | $274,000 |
| 2017 | $11,896 | $1,009,000 | $735,000 | $274,000 |
| 2016 | $11,499 | $972,000 | $722,000 | $250,000 |
| 2015 | $11,259 | $974,000 | $722,000 | $252,000 |
Source: Public Records
Map
Nearby Homes
- 9 Hampden St
- 85 Grove St Unit 311
- 85 Grove St Unit 306
- 20 Arden Rd
- 5 Abbott St
- 100 Linden St Unit 111
- 63 Linden St Unit 1
- 222 Grove St
- 333 Cartwright Rd
- 15 Alden Rd
- 28 Rice St
- 148 Weston Rd Unit 208
- 148 Weston Rd Unit 207
- 63 Oak St Unit B
- 16 Stearns Rd Unit 101
- 16 Stearns Rd Unit 106
- 16 Stearns Rd Unit 103
- 16 Stearns Rd Unit 301
- 16 Stearns Rd Unit 304
- 16 Stearns Rd Unit 104