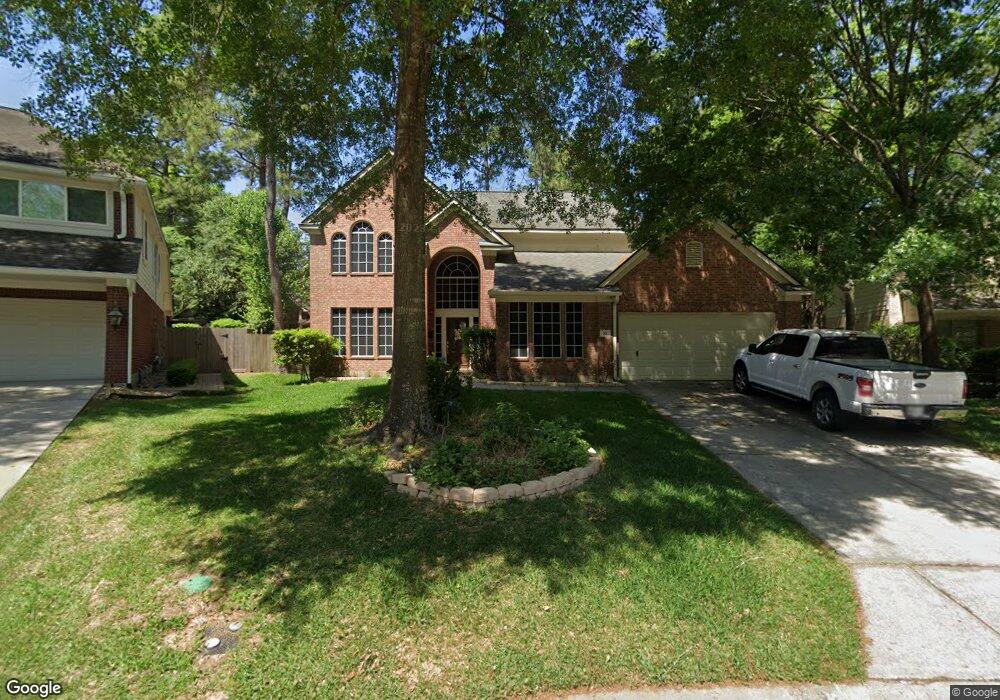
25 Stockbridge Landing Ct Unit BSTA Spring, TX 77382
Alden Bridge NeighborhoodEstimated Value: $540,514 - $601,000
4
Beds
3
Baths
2,722
Sq Ft
$212/Sq Ft
Est. Value
About This Home
This home is located at 25 Stockbridge Landing Ct Unit BSTA, Spring, TX 77382 and is currently estimated at $577,629, approximately $212 per square foot. 25 Stockbridge Landing Ct Unit BSTA is a home located in Montgomery County with nearby schools including Bush Elementary School, Mitchell Intermediate School, and McCullough Junior High School.
Ownership History
Date
Name
Owned For
Owner Type
Purchase Details
Closed on
Jan 25, 2017
Sold by
Wideman Janna and Wideman Randy
Bought by
Inman Carl R and Inman Lindsey
Current Estimated Value
Purchase Details
Closed on
Nov 17, 2006
Sold by
Smith Lindy and Smith Luanne
Bought by
Inman Carl R and Inman Lindsey
Home Financials for this Owner
Home Financials are based on the most recent Mortgage that was taken out on this home.
Original Mortgage
$218,800
Interest Rate
8.37%
Mortgage Type
Purchase Money Mortgage
Purchase Details
Closed on
Nov 15, 2006
Sold by
Smith Lindy R and Smith Luanne
Bought by
Wideman Randy and Wideman Janna
Home Financials for this Owner
Home Financials are based on the most recent Mortgage that was taken out on this home.
Original Mortgage
$218,800
Interest Rate
8.37%
Mortgage Type
Purchase Money Mortgage
Purchase Details
Closed on
Nov 30, 1998
Sold by
Pulte Homes Of Texas Lp
Bought by
Smith Lindy R and Smith Luanne
Home Financials for this Owner
Home Financials are based on the most recent Mortgage that was taken out on this home.
Original Mortgage
$141,550
Interest Rate
6.69%
Create a Home Valuation Report for This Property
The Home Valuation Report is an in-depth analysis detailing your home's value as well as a comparison with similar homes in the area
Home Values in the Area
Average Home Value in this Area
Purchase History
| Date | Buyer | Sale Price | Title Company |
|---|---|---|---|
| Inman Carl R | -- | Chicago Title | |
| Inman Carl R | -- | -- | |
| Wideman Randy | -- | Vanguard Title Co | |
| Smith Lindy R | -- | Alamo Title 32 |
Source: Public Records
Mortgage History
| Date | Status | Borrower | Loan Amount |
|---|---|---|---|
| Previous Owner | Wideman Randy | $218,800 | |
| Previous Owner | Smith Lindy R | $141,550 |
Source: Public Records
Tax History Compared to Growth
Tax History
| Year | Tax Paid | Tax Assessment Tax Assessment Total Assessment is a certain percentage of the fair market value that is determined by local assessors to be the total taxable value of land and additions on the property. | Land | Improvement |
|---|---|---|---|---|
| 2025 | $6,320 | $472,916 | -- | -- |
| 2024 | $5,696 | $429,924 | -- | -- |
| 2023 | $5,696 | $390,840 | $70,000 | $447,050 |
| 2022 | $7,202 | $355,310 | $70,000 | $326,380 |
| 2021 | $7,045 | $323,010 | $32,060 | $290,950 |
| 2020 | $7,427 | $321,070 | $32,060 | $289,010 |
| 2019 | $7,379 | $309,190 | $32,060 | $277,130 |
| 2018 | $7,190 | $301,240 | $32,060 | $269,180 |
| 2017 | $7,547 | $312,390 | $32,060 | $280,330 |
| 2016 | $7,547 | $312,390 | $32,060 | $280,330 |
| 2015 | $6,755 | $288,500 | $32,060 | $256,440 |
| 2014 | $6,755 | $277,740 | $32,060 | $245,680 |
Source: Public Records
Map
Nearby Homes
- 54 Legend Mill Ct
- 78 Stockbridge Landing
- 105 N Hollylaurel Cir
- 34 S Old Cedar Cir
- 15 Marble Rock Place
- 7 Verbena Bend Place
- 38 Wrens Song Place
- 122 N Camellia Grove Cir
- 118 N Camellia Grove Cir
- 151 E Greenhill Terrace Place
- 43 Wrens Song Place
- 86 N Camellia Grove Cir
- 101 N Villa Oaks Dr
- 127 E Greenhill Terrace Place
- 11 Endor Forest Place
- 115 E Greenhill Terrace Place
- 14 Clarion Ridge
- 85 Summer Lark Place
- 35 Serene Creek Place
- 48 W New Avery Place
- 25 Stockbridge Landing Ct
- 21 Stockbridge Landing Ct
- 29 Stockbridge Landing Ct
- 131 W Stockbridge Landing Cir
- 135 W Stockbridge Landing Cir
- 127 W Stockbridge Landing Cir
- 139 W Stockbridge Landing Cir
- 33 Stockbridge Landing Ct
- 123 W Stockbridge Landing Cir
- 37 Stockbridge Landing Ct
- 22 Stockbridge Landing Dr
- 18 Stockbridge Landing
- 18 Stockbridge Landing Dr
- 22 Stockbridge Landing
- 119 W Stockbridge Landing Cir
- 26 Stockbridge Landing Dr
- 30 Stockbridge Landing
- 14 Stockbridge Landing Dr
- 30 Stockbridge Landing Dr
- 34 Stockbridge Landing Dr