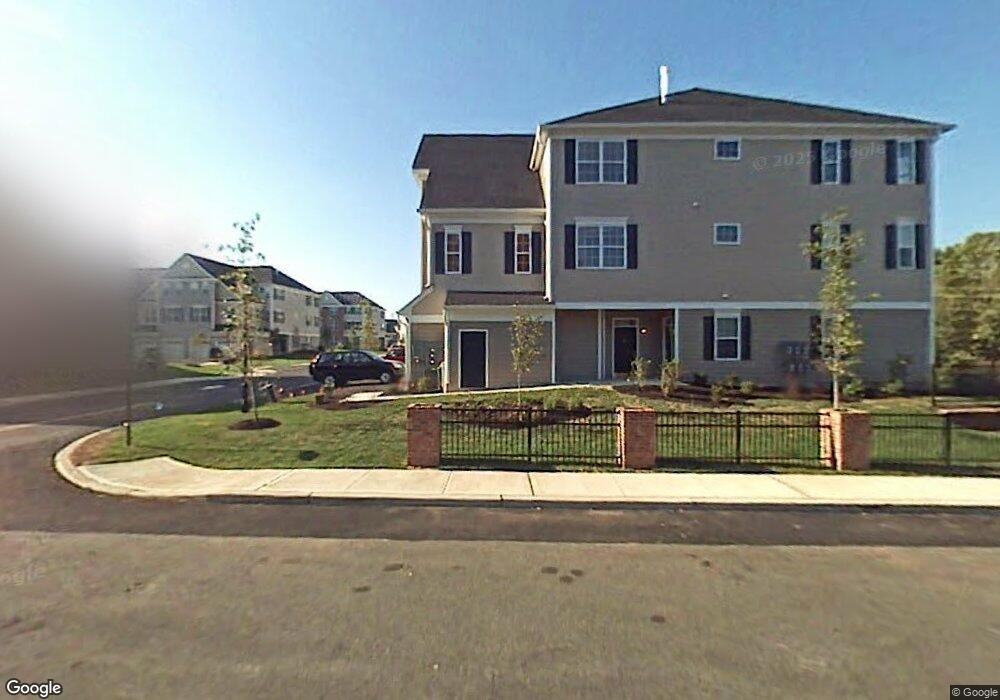
25 Swing Bridge Ln Unit 111 South Bound Brook, NJ 08880
Estimated Value: $496,000 - $502,000
--
Bed
--
Bath
2,096
Sq Ft
$238/Sq Ft
Est. Value
About This Home
This home is located at 25 Swing Bridge Ln Unit 111, South Bound Brook, NJ 08880 and is currently estimated at $498,672, approximately $237 per square foot. 25 Swing Bridge Ln Unit 111 is a home located in Somerset County with nearby schools including Robert Morris School and Green Brook Academy.
Ownership History
Date
Name
Owned For
Owner Type
Purchase Details
Closed on
Aug 30, 2007
Sold by
Matzel & Mumford At South Bound Brook Ur
Bought by
Kraker Jason
Current Estimated Value
Home Financials for this Owner
Home Financials are based on the most recent Mortgage that was taken out on this home.
Original Mortgage
$68,490
Interest Rate
6.34%
Mortgage Type
Unknown
Create a Home Valuation Report for This Property
The Home Valuation Report is an in-depth analysis detailing your home's value as well as a comparison with similar homes in the area
Home Values in the Area
Average Home Value in this Area
Purchase History
| Date | Buyer | Sale Price | Title Company |
|---|---|---|---|
| Kraker Jason | $464,766 | None Available |
Source: Public Records
Mortgage History
| Date | Status | Borrower | Loan Amount |
|---|---|---|---|
| Closed | Kraker Jason | $68,490 | |
| Open | Kraker Jason | $371,800 |
Source: Public Records
Tax History Compared to Growth
Tax History
| Year | Tax Paid | Tax Assessment Tax Assessment Total Assessment is a certain percentage of the fair market value that is determined by local assessors to be the total taxable value of land and additions on the property. | Land | Improvement |
|---|---|---|---|---|
| 2025 | -- | $320,000 | $60,000 | $260,000 |
| 2024 | -- | $320,000 | $60,000 | $260,000 |
| 2023 | -- | $320,000 | $60,000 | $260,000 |
| 2022 | -- | $320,000 | $60,000 | $260,000 |
| 2021 | $0 | $320,000 | $60,000 | $260,000 |
| 2020 | $0 | $380,600 | $60,000 | $320,600 |
| 2019 | $0 | $380,600 | $60,000 | $320,600 |
| 2018 | $0 | $380,600 | $60,000 | $320,600 |
| 2017 | $0 | $380,600 | $60,000 | $320,600 |
| 2016 | $0 | $380,600 | $60,000 | $320,600 |
| 2015 | -- | $380,600 | $60,000 | $320,600 |
| 2014 | -- | $380,600 | $60,000 | $320,600 |
Source: Public Records
Map
Nearby Homes
- 20 Patriots Path
- 165 Prospect St
- 123 Elizabeth St
- 3 Edgewood Terrace
- 8 Von Steuben Ln
- 112 East St
- 71 Remsen St
- 2 Drake St
- 206 Bathgate Ave
- 231 Beck Ave
- 285 Maple Ave
- 112-114 E Union Ave
- 112 E Union Ave
- 320 Church St
- 205 Ashland Rd
- 535 Madison Ave
- 311 Ashland Rd
- 10 Maplehurst Ln
- 14 E Maple Ave
- 34 van Keuren Ave Unit 38
- 23 Swing Bridge Ln
- 29 Swing Bridge Ln
- 17 Swing Bridge Ln Unit 115
- 27 Swing Bridge Ln
- 15 Swing Bridge Ln Unit 116
- 33 Swing Bridge Ln
- 31 Swing Bridge Ln
- 11 Swing Bridge Ln Unit 117
- 9 Swing Bridge Ln Unit 118
- 37 Swing Bridge Ln
- 7 Swing Bridge Ln Unit 119
- 3 Tory Jack Terrace
- 5 Swing Bridge Ln Unit 120
- 1 Tory Jack Terrace Unit 312
- 39 Swing Bridge Ln
- 41 Swing Bridge Ln
- 3 Swing Bridge Ln Unit 121
- 1 Swing Bridge Ln Unit 122
- 7 Tory Jack Terrace
- 5 Tory Jack Terrace