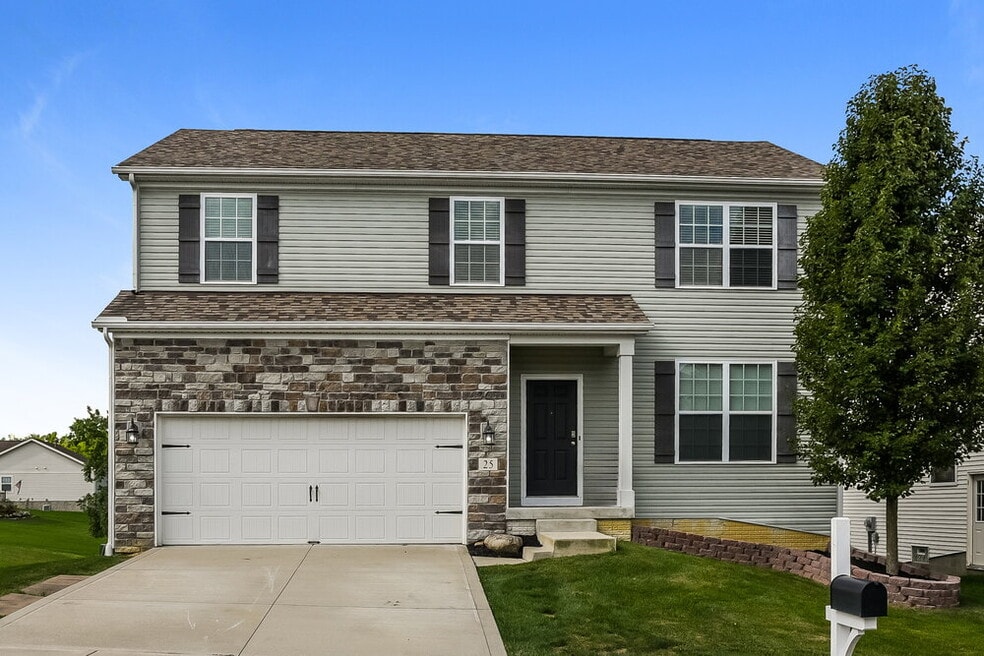
25 W Twin Maple Ave Lithopolis, OH 43136
Bloom NeighborhoodAbout This Home
Please note, our homes are available on a first-come, first-serve basis and are not reserved until the holding fee agreement is signed and the holding fee is paid by the primary applicant.
This home features Progress Smart Home - Progress Residential's smart home app, which allows you to control the home securely from any of your devices. Learn more at
Coming soon! This home is currently being enjoyed by another resident but will be available soon. Please respect their privacy and do not disturb. You can complete the application process and reserve this home for a $500 non-refundable holding fee until it's ready for move-in. This fee must be paid within 24 hours of being pre-qualified and will be applied to your first month’s rent if you enter into a lease for this home.
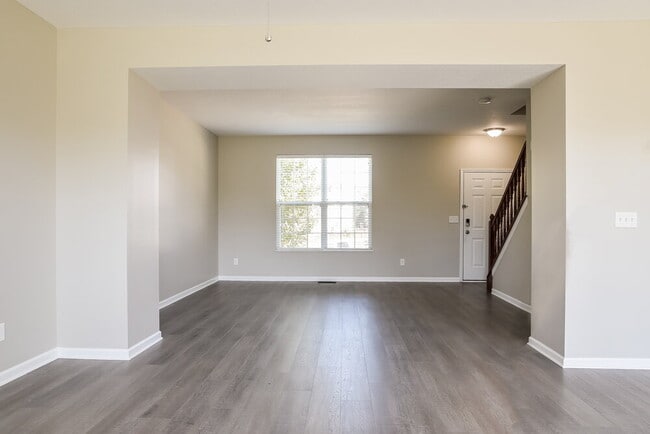
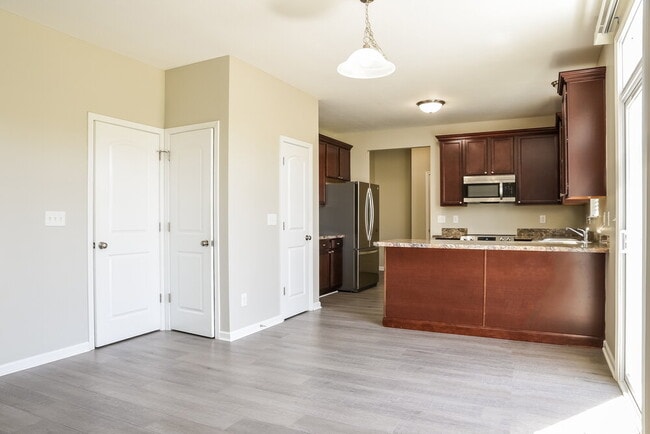
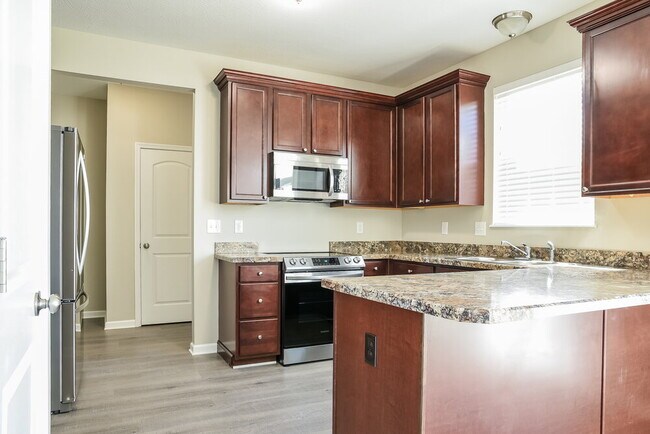
Interested in this home? You clearly have exceptional taste. This charming 3-bedroom, 3-bathroom home is not only pet-friendly, but also equipped with smart home features to make everyday life more convenient and connected. Homes like this don’t stay on the market for long—don’t miss your chance to make it yours. Apply today!

Map
- 56 W Twin Maple Ave
- 526 Market St Unit 526
- 539 Market St Unit 539
- 549 Crestview Dr
- 73 E North St
- 11511 Lithopolis Rd NW
- 330 W Columbus St
- 310 Abbey Ave
- 0 Columbus St Unit 225023784
- 750 Faulkner Dr
- Harmony Plan at The Summit at Wagnalls Run
- Henley Plan at The Summit at Wagnalls Run
- Bellamy Plan at The Summit at Wagnalls Run
- Stamford Plan at The Summit at Wagnalls Run
- Aldridge Plan at The Summit at Wagnalls Run
- Fairton Plan at The Summit at Wagnalls Run
- Juniper Plan at The Summit at Wagnalls Run
- Chatham Plan at The Summit at Wagnalls Run
- Pendleton Plan at The Summit at Wagnalls Run
- 1400 Hansberry Dr
- 13 Stoney Bluff Way
- 71 W North St Unit C
- 109 Sandburg Dr
- 122 Faulkner Dr
- 6185 Dietz Dr
- 7037 Crescent Boat Ln
- 6693 Jennyann Way
- 6340 Saddler Way
- 202 Kramer Mills Dr
- 204 Kramer Mills Dr
- 203 Kramer Mills Dr
- 207 Kramer Mills Dr
- 206 Kramer Mills Dr
- 205 Kramer Mills Dr
- 5512 Meadow Passage Dr
- 7505 Hemrich Dr
- 7525 Hemrich Dr
- 7474 Canal Highlands Blvd
- 5393 Blanchard Dr
- 5389 Blanchard Dr