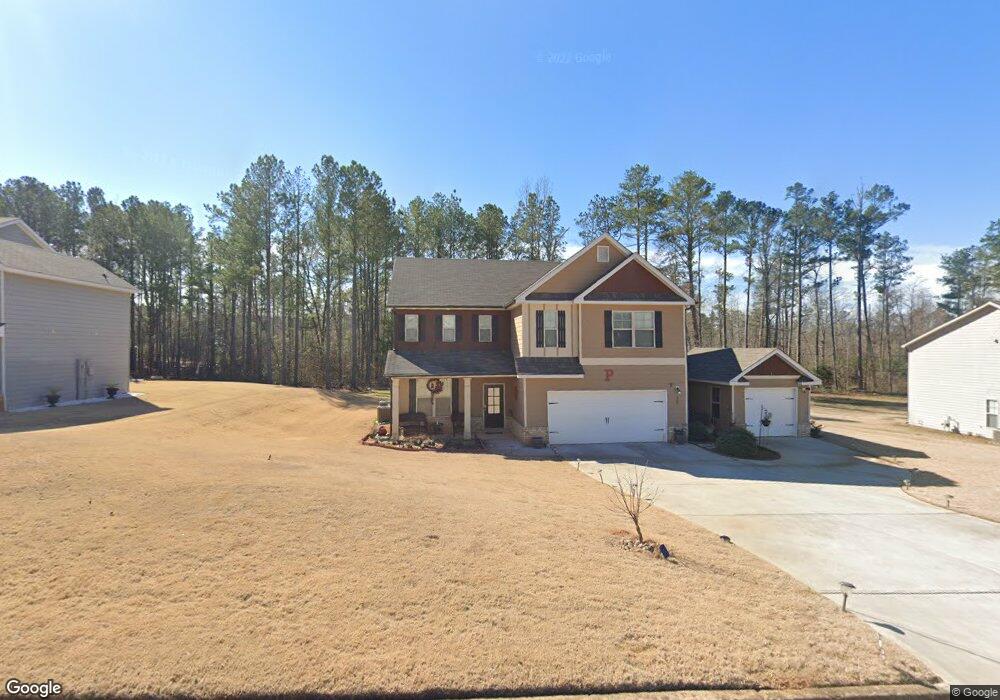
25 Wellbrook Dr Unit 57 Covington, GA 30016
Estimated Value: $367,401 - $455,000
4
Beds
3
Baths
3,000
Sq Ft
$134/Sq Ft
Est. Value
About This Home
This home is located at 25 Wellbrook Dr Unit 57, Covington, GA 30016 and is currently estimated at $401,100, approximately $133 per square foot. 25 Wellbrook Dr Unit 57 is a home located in Newton County with nearby schools including Rocky Plains Elementary School, Indian Creek Middle School, and Alcovy High School.
Ownership History
Date
Name
Owned For
Owner Type
Purchase Details
Closed on
Sep 18, 2018
Sold by
Sunrise Builder Inc
Bought by
Ventura Aracely
Current Estimated Value
Home Financials for this Owner
Home Financials are based on the most recent Mortgage that was taken out on this home.
Original Mortgage
$220,572
Outstanding Balance
$191,159
Interest Rate
4.5%
Mortgage Type
New Conventional
Estimated Equity
$209,941
Purchase Details
Closed on
Mar 17, 2017
Sold by
Not Provided
Bought by
Sunrise Builder Inc
Purchase Details
Closed on
Jul 12, 2016
Sold by
Pommard Llc
Bought by
Mount Eagle Llc
Create a Home Valuation Report for This Property
The Home Valuation Report is an in-depth analysis detailing your home's value as well as a comparison with similar homes in the area
Home Values in the Area
Average Home Value in this Area
Purchase History
| Date | Buyer | Sale Price | Title Company |
|---|---|---|---|
| Ventura Aracely | $245,080 | -- | |
| Sunrise Builder Inc | $104,000 | -- | |
| Mount Eagle Llc | -- | -- |
Source: Public Records
Mortgage History
| Date | Status | Borrower | Loan Amount |
|---|---|---|---|
| Open | Ventura Aracely | $220,572 |
Source: Public Records
Tax History
| Year | Tax Paid | Tax Assessment Tax Assessment Total Assessment is a certain percentage of the fair market value that is determined by local assessors to be the total taxable value of land and additions on the property. | Land | Improvement |
|---|---|---|---|---|
| 2025 | $3,874 | $155,680 | $20,400 | $135,280 |
| 2024 | $3,866 | $152,600 | $20,400 | $132,200 |
| 2023 | $3,978 | $146,600 | $7,200 | $139,400 |
| 2022 | $3,327 | $122,600 | $7,200 | $115,400 |
| 2021 | $3,302 | $108,880 | $7,200 | $101,680 |
| 2020 | $3,333 | $99,200 | $7,200 | $92,000 |
| 2019 | $3,212 | $94,160 | $7,200 | $86,960 |
| 2018 | $120 | $7,000 | $7,000 | $0 |
| 2017 | $172 | $5,000 | $5,000 | $0 |
| 2016 | $172 | $5,000 | $5,000 | $0 |
| 2015 | $103 | $3,000 | $3,000 | $0 |
| 2014 | $103 | $3,000 | $0 | $0 |
Source: Public Records
Map
Nearby Homes
- 0 Highway 81 S Unit 7670352
- 15 Granville Ln
- 100 Willow Shoals Dr
- 125 Willow Shoals Dr
- 230 Barcelona Dr
- 230 Laurel Way
- 179 Ellis Trail
- 66 Ellis Trail
- 395 Willow Shoals Dr
- 90 Harvey Ave
- 335 Glen Echo Dr
- 60 Muirfield Dr
- 345 Arthurs Ln
- 15 Glen Echo Dr
- 0 Chestnut Rd Unit 10696786
- 0 Chestnut Rd Unit 7723609
- 10 Lamar Ln
- 10 Stoneview Cir
- 1752 Highway 162
- 75 Cannonade Ct
- 25 Wellbrook Dr Unit 2
- 15 Wellbrook Dr Unit 1
- 35 Wellbrook Dr Unit 3
- 45 Wellbrook Dr Unit 4
- 45 Wellbrook Dr
- 10 Wellbrook Ct
- 10 Wellbrook Dr Unit 61
- 55 Wellbrook Dr
- 20 Wellbrook Ct
- 20 Wellbrook Ct Unit 60
- 0 Highway 81 S
- 0 Highway 81 S Unit 10232585
- 0 Highway 81 S Unit 7312936
- 0 Highway 81 S Unit 7138053
- 0 Highway 81 S Unit 7425606
- 0 Hwy 81 Washington St and Flat Shoals Unit 7131440
- 0 Highway 81 S Unit 7506215
- 0 Highway 81 S Unit 7413774
- 0 Highway 81 S Unit 6956473
- 0 Highway 81 S Unit 6956471
Your Personal Tour Guide
Ask me questions while you tour the home.