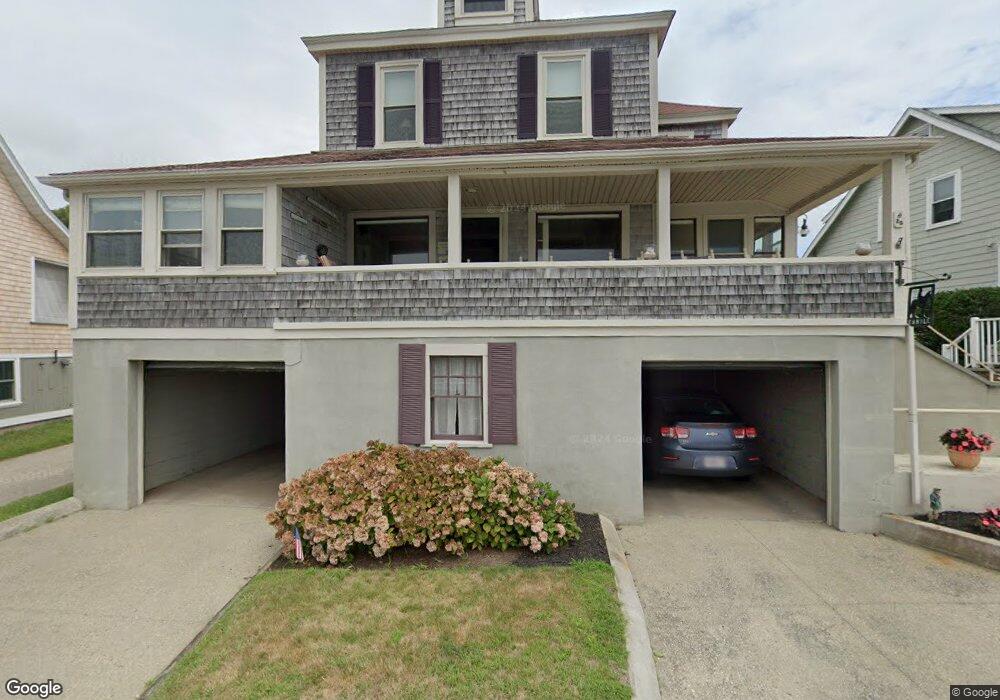
25 West Ave North Falmouth, MA 02556
Estimated Value: $820,000 - $1,301,000
4
Beds
2
Baths
1,600
Sq Ft
$684/Sq Ft
Est. Value
About This Home
This home is located at 25 West Ave, North Falmouth, MA 02556 and is currently estimated at $1,093,622, approximately $683 per square foot. 25 West Ave is a home located in Barnstable County with nearby schools including North Falmouth Elementary School, Morse Pond School, and Lawrence School.
Ownership History
Date
Name
Owned For
Owner Type
Purchase Details
Closed on
Nov 17, 2015
Sold by
Walsh Carol A and Walsh Francis J
Bought by
Casstevens Patricia and Walsh Carol A
Current Estimated Value
Purchase Details
Closed on
Nov 4, 2015
Sold by
25 West Avenue T and 25 Walsh
Bought by
Walsh Carol A and Walsh Francis J
Purchase Details
Closed on
May 5, 2010
Sold by
Walsh Francis J and Walsh Carol A
Bought by
25 West Avenue T and 25 Walsh
Purchase Details
Closed on
Oct 9, 1998
Sold by
Cahill John David
Bought by
Walsh Francis J and Walsh Carol A
Create a Home Valuation Report for This Property
The Home Valuation Report is an in-depth analysis detailing your home's value as well as a comparison with similar homes in the area
Home Values in the Area
Average Home Value in this Area
Purchase History
| Date | Buyer | Sale Price | Title Company |
|---|---|---|---|
| Casstevens Patricia | -- | -- | |
| Casstevens Patricia | -- | -- | |
| Walsh Carol A | -- | -- | |
| Walsh Carol A | -- | -- | |
| Casstevens Patricia | -- | -- | |
| Casstevens Patricia | -- | -- | |
| 25 West Avenue T | -- | -- | |
| 25 West Avenue T | -- | -- | |
| Walsh Francis J | $50,000 | -- | |
| Walsh Francis J | $50,000 | -- | |
| Walsh Francis J | $50,000 | -- |
Source: Public Records
Tax History Compared to Growth
Tax History
| Year | Tax Paid | Tax Assessment Tax Assessment Total Assessment is a certain percentage of the fair market value that is determined by local assessors to be the total taxable value of land and additions on the property. | Land | Improvement |
|---|---|---|---|---|
| 2025 | $5,867 | $999,500 | $674,100 | $325,400 |
| 2024 | $5,697 | $907,200 | $612,800 | $294,400 |
| 2023 | $6,179 | $892,900 | $612,800 | $280,100 |
| 2022 | $5,366 | $666,600 | $409,100 | $257,500 |
| 2021 | $5,240 | $616,500 | $391,300 | $225,200 |
| 2020 | $4,990 | $580,900 | $355,700 | $225,200 |
| 2019 | $4,897 | $572,100 | $355,700 | $216,400 |
| 2018 | $4,877 | $567,100 | $355,700 | $211,400 |
| 2017 | $4,666 | $547,000 | $355,700 | $191,300 |
| 2016 | $4,578 | $547,000 | $355,700 | $191,300 |
| 2015 | $4,442 | $542,400 | $355,700 | $186,700 |
| 2014 | $4,306 | $528,400 | $355,700 | $172,700 |
Source: Public Records
Map
Nearby Homes