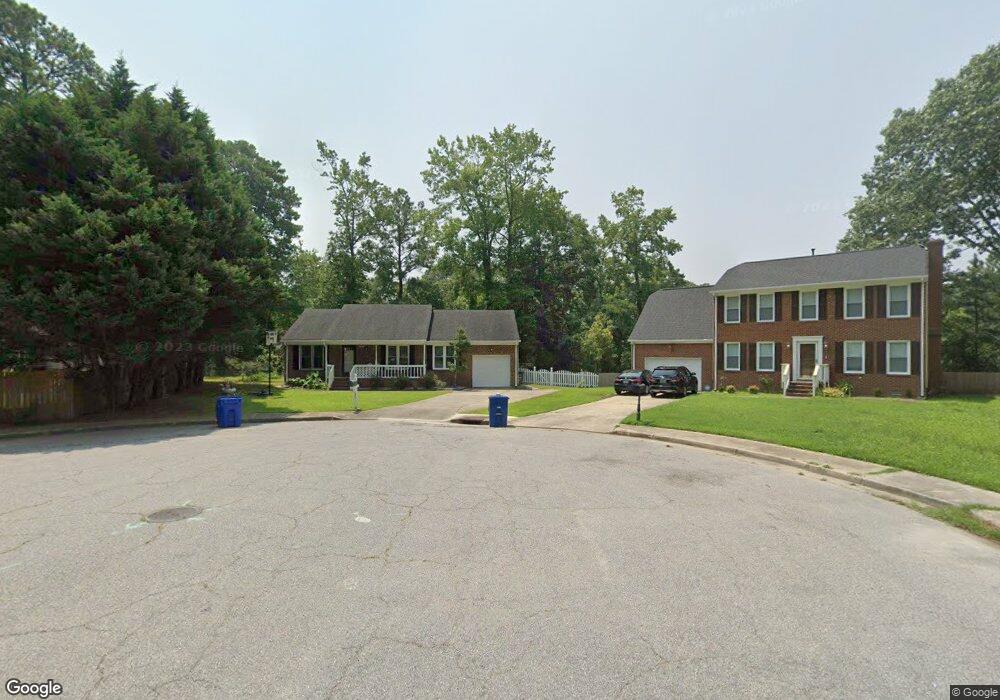
25 Windy Pines Crescent Portsmouth, VA 23703
Churchland NeighborhoodEstimated Value: $306,000 - $347,000
3
Beds
2
Baths
1,419
Sq Ft
$227/Sq Ft
Est. Value
About This Home
This home is located at 25 Windy Pines Crescent, Portsmouth, VA 23703 and is currently estimated at $322,704, approximately $227 per square foot. 25 Windy Pines Crescent is a home located in Portsmouth City with nearby schools including Churchland Primary/Intermediate School, Churchland Middle School, and Churchland High School.
Ownership History
Date
Name
Owned For
Owner Type
Purchase Details
Closed on
Oct 18, 2016
Sold by
Cruz Thomas Nixon
Bought by
Popanes Anabel P and Popanes Abegail P
Current Estimated Value
Home Financials for this Owner
Home Financials are based on the most recent Mortgage that was taken out on this home.
Original Mortgage
$181,649
Outstanding Balance
$144,814
Interest Rate
3.37%
Mortgage Type
FHA
Estimated Equity
$177,890
Purchase Details
Closed on
Aug 8, 2013
Sold by
Cruz Jose O
Bought by
Cruz Thomas N
Purchase Details
Closed on
Nov 11, 2005
Sold by
Ehlers Ronald P
Bought by
Cruz Jose O
Purchase Details
Closed on
Apr 13, 2000
Sold by
Bailey Kevin S
Bought by
Ehlers Ronald P
Home Financials for this Owner
Home Financials are based on the most recent Mortgage that was taken out on this home.
Original Mortgage
$117,600
Interest Rate
8.23%
Create a Home Valuation Report for This Property
The Home Valuation Report is an in-depth analysis detailing your home's value as well as a comparison with similar homes in the area
Home Values in the Area
Average Home Value in this Area
Purchase History
| Date | Buyer | Sale Price | Title Company |
|---|---|---|---|
| Popanes Anabel P | $185,000 | Attorney | |
| Cruz Thomas N | -- | -- | |
| Cruz Jose O | $229,000 | -- | |
| Ehlers Ronald P | $114,500 | -- |
Source: Public Records
Mortgage History
| Date | Status | Borrower | Loan Amount |
|---|---|---|---|
| Open | Popanes Anabel P | $181,649 | |
| Previous Owner | Ehlers Ronald P | $117,600 |
Source: Public Records
Tax History Compared to Growth
Tax History
| Year | Tax Paid | Tax Assessment Tax Assessment Total Assessment is a certain percentage of the fair market value that is determined by local assessors to be the total taxable value of land and additions on the property. | Land | Improvement |
|---|---|---|---|---|
| 2025 | $3,672 | $287,450 | $99,000 | $188,450 |
| 2024 | $3,672 | $284,600 | $99,000 | $185,600 |
| 2023 | $3,461 | $263,180 | $99,000 | $164,180 |
| 2022 | $3,021 | $232,410 | $82,500 | $149,910 |
| 2021 | $2,607 | $200,530 | $72,040 | $128,490 |
| 2020 | $2,562 | $197,100 | $68,610 | $128,490 |
| 2019 | $2,469 | $189,960 | $68,610 | $121,350 |
| 2018 | $2,469 | $189,960 | $68,610 | $121,350 |
| 2017 | $2,469 | $189,960 | $68,610 | $121,350 |
| 2016 | $2,469 | $189,960 | $68,610 | $121,350 |
| 2015 | $2,469 | $189,960 | $68,610 | $121,350 |
| 2014 | $2,412 | $189,960 | $68,610 | $121,350 |
Source: Public Records
Map
Nearby Homes
- 21 Windy Pines Crescent
- 5833 Hawthorne Ln
- 4444 Southampton Arch
- 5728 Hawthorne Ln
- 4619 River Shore Rd
- 4224 Burnham Dr
- 8 Compass Ct
- 4726 River Shore Rd
- 4200 Quince Rd
- 4232 Summerset Dr
- 17 Shoal Ct
- 4071 Long Point Blvd
- 4100 Mayfair Way
- 5606 Gregory Ct
- 5693 Rivermill Cir
- 4028 Swannanoa Dr
- 5807 Dunkin St
- 6750 Burbage Landing Cir
- 6602 James Point Ct
- 6446 Olde Bullocks Cir
- 23 Windy Pines Crescent
- 3859 Sunset Point
- 4425 Windy Pines Bend
- 4429 Windy Pines Bend
- 3855 Sunset Point
- 4421 Windy Pines Bend
- 3860 Sunset Point
- 19 Windy Pines Ct
- 3851 Sunset Point
- 17 Windy Pines Crescent
- 4417 Windy Pines Bend
- 3813 Windy Pines Landing
- 3856 Sunset Point
- 1 Windy Pines Crescent
- 7 Sunset Ct
- 15 Windy Pines Crescent
- 4413 Windy Pines Bend
- 3 Windy Pines Ct
- 3852 Sunset Point
- 3809 Windy Pines Landing