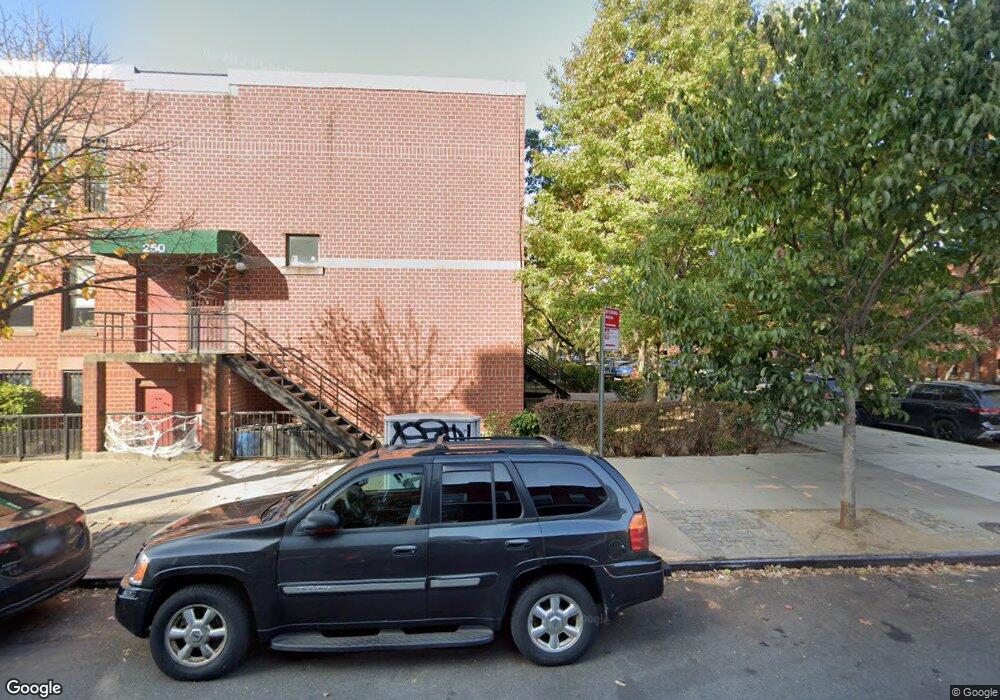
250-256 Columbia St Unit 40F Brooklyn, NY 11231
Carroll Gardens NeighborhoodEstimated Value: $887,000 - $1,011,000
--
Bed
--
Bath
794
Sq Ft
$1,225/Sq Ft
Est. Value
About This Home
This home is located at 250-256 Columbia St Unit 40F, Brooklyn, NY 11231 and is currently estimated at $972,705, approximately $1,225 per square foot. 250-256 Columbia St Unit 40F is a home located in Kings County with nearby schools including P.S. 58 - The Carroll, PAVE Elementary, and International School of Brooklyn.
Ownership History
Date
Name
Owned For
Owner Type
Purchase Details
Closed on
Jan 23, 2006
Sold by
Gardiner John T and Gardiner Sally J
Bought by
Fleischman-Maenza Iris and Maenza Michael
Current Estimated Value
Home Financials for this Owner
Home Financials are based on the most recent Mortgage that was taken out on this home.
Original Mortgage
$285,000
Outstanding Balance
$160,571
Interest Rate
6.31%
Mortgage Type
Purchase Money Mortgage
Estimated Equity
$812,134
Purchase Details
Closed on
Oct 20, 2004
Sold by
Gonzalez Leonardo
Bought by
Gardiner John T and Gardiner Sally J
Home Financials for this Owner
Home Financials are based on the most recent Mortgage that was taken out on this home.
Original Mortgage
$332,100
Interest Rate
5.71%
Mortgage Type
Purchase Money Mortgage
Purchase Details
Closed on
Sep 14, 1995
Sold by
State Of New York Mtg Agency
Bought by
Gonzalez Leonardo
Create a Home Valuation Report for This Property
The Home Valuation Report is an in-depth analysis detailing your home's value as well as a comparison with similar homes in the area
Home Values in the Area
Average Home Value in this Area
Purchase History
| Date | Buyer | Sale Price | Title Company |
|---|---|---|---|
| Fleischman-Maenza Iris | $435,000 | -- | |
| Gardiner John T | $369,000 | -- | |
| Gonzalez Leonardo | $60,000 | Ticor Title Guarantee Compan |
Source: Public Records
Mortgage History
| Date | Status | Borrower | Loan Amount |
|---|---|---|---|
| Open | Fleischman-Maenza Iris | $285,000 | |
| Previous Owner | Gardiner John T | $332,100 |
Source: Public Records
Tax History Compared to Growth
Tax History
| Year | Tax Paid | Tax Assessment Tax Assessment Total Assessment is a certain percentage of the fair market value that is determined by local assessors to be the total taxable value of land and additions on the property. | Land | Improvement |
|---|---|---|---|---|
| 2025 | $3,747 | $53,936 | $1,464 | $52,472 |
| 2024 | $3,747 | $49,230 | $1,464 | $47,766 |
| 2023 | $3,760 | $53,272 | $1,464 | $51,808 |
| 2022 | $3,487 | $49,113 | $1,464 | $47,649 |
| 2021 | $3,468 | $44,895 | $1,464 | $43,431 |
| 2020 | $1,626 | $42,640 | $1,464 | $41,176 |
| 2019 | $3,252 | $37,079 | $1,464 | $35,615 |
| 2018 | $3,145 | $15,428 | $582 | $14,846 |
| 2017 | $2,967 | $14,555 | $593 | $13,962 |
| 2016 | $2,745 | $13,732 | $652 | $13,080 |
| 2015 | $1,656 | $12,956 | $794 | $12,162 |
| 2014 | $1,656 | $12,956 | $794 | $12,162 |
Source: Public Records
Map
Nearby Homes
- 57 Summit St
- 10 Carroll St
- 81 President St Unit 51-A
- 255 Columbia St Unit S-4
- 115 Van Brunt St
- 113 Union St Unit 3A
- 118 Union St Unit 9A
- 124 President St
- 37 Woodhull St
- 51 Woodhull St Unit 2A
- 51 Woodhull St Unit 5B
- 139 Sackett St Unit 2
- 145 President St Unit 6-C
- 145 President St Unit 3-B
- 130 Degraw St
- 177 Union St Unit 2
- 178 Sackett St
- 181 Columbia St
- 60 Tiffany Place Unit 2G
- 506 Henry St Unit PH
- 55 Carroll St Unit 39
- 47 Carroll St Unit 43
- 51 Carroll St Unit 41
- 53 Carroll St Unit 40
- 55 Carroll St
- 55 Carroll St Unit 39
- 51 Carroll St Unit 3
- 47 Carroll St Unit Grdn
- 250-256 Columbia St Unit 42A
- 250-256 Columbia St
- 250-256 Columbia St Unit 37E
- 250-256 Columbia St Unit 45A
- 250-256 Columbia St Unit 43A
- 250-256 Columbia St Unit 44A
- 250-256 Columbia St Unit 41A
- 250-256 Columbia St Unit 40A
- 250-256 Columbia St Unit 36F
- 250-256 Columbia St Unit 38A
- 47 Carroll St Unit 2
- 47 Carroll St Unit 1