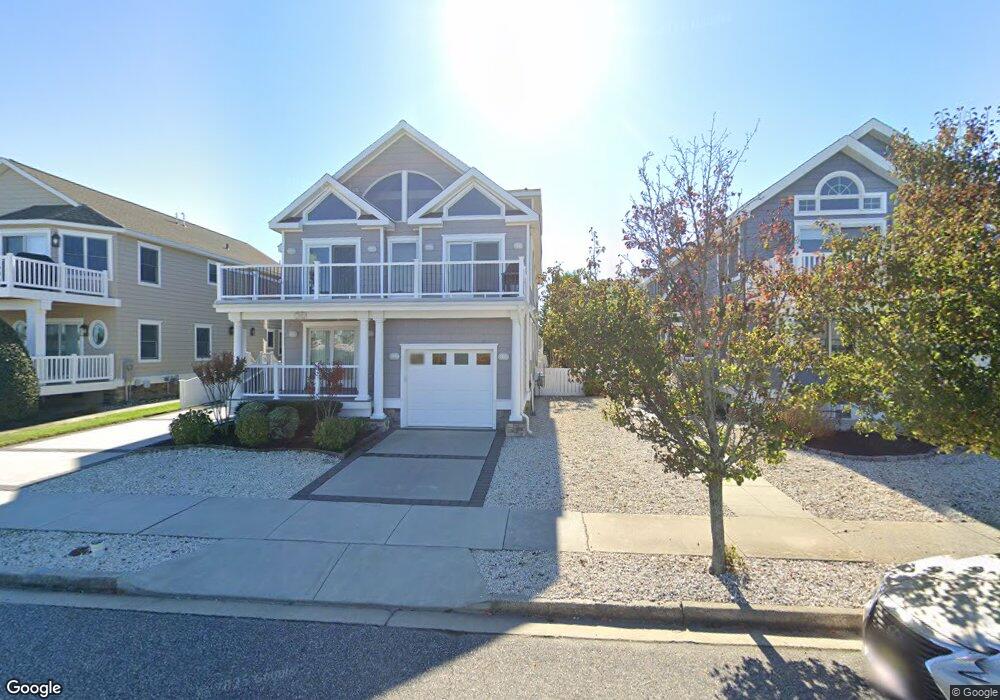
250 40th St Avalon, NJ 08202
Estimated Value: $3,246,422 - $4,020,000
--
Bed
--
Bath
3,123
Sq Ft
$1,169/Sq Ft
Est. Value
About This Home
This home is located at 250 40th St, Avalon, NJ 08202 and is currently estimated at $3,649,856, approximately $1,168 per square foot. 250 40th St is a home located in Cape May County with nearby schools including Avalon Elementary School.
Ownership History
Date
Name
Owned For
Owner Type
Purchase Details
Closed on
Dec 26, 2012
Sold by
Lacey Alison C
Bought by
Lacey Andrew M and Lacey Michael W
Current Estimated Value
Purchase Details
Closed on
Nov 23, 2009
Sold by
Lacey Andrew M and Lacey Alison
Bought by
Lacey Alison C
Purchase Details
Closed on
Sep 30, 1999
Sold by
Wallace Frances Longstreth
Bought by
Lacey Andrew M and Lacey Alison
Home Financials for this Owner
Home Financials are based on the most recent Mortgage that was taken out on this home.
Original Mortgage
$150,000
Outstanding Balance
$45,360
Interest Rate
7.85%
Estimated Equity
$3,604,496
Create a Home Valuation Report for This Property
The Home Valuation Report is an in-depth analysis detailing your home's value as well as a comparison with similar homes in the area
Home Values in the Area
Average Home Value in this Area
Purchase History
| Date | Buyer | Sale Price | Title Company |
|---|---|---|---|
| Lacey Andrew M | -- | None Available | |
| Lacey Alison C | -- | None Available | |
| Lacey Andrew M | $320,000 | -- |
Source: Public Records
Mortgage History
| Date | Status | Borrower | Loan Amount |
|---|---|---|---|
| Open | Lacey Andrew M | $150,000 |
Source: Public Records
Tax History Compared to Growth
Tax History
| Year | Tax Paid | Tax Assessment Tax Assessment Total Assessment is a certain percentage of the fair market value that is determined by local assessors to be the total taxable value of land and additions on the property. | Land | Improvement |
|---|---|---|---|---|
| 2025 | $10,596 | $1,725,800 | $855,000 | $870,800 |
| 2024 | $10,596 | $1,725,800 | $855,000 | $870,800 |
| 2023 | $10,489 | $1,722,400 | $855,000 | $867,400 |
| 2022 | $9,783 | $1,722,400 | $855,000 | $867,400 |
| 2021 | $9,422 | $1,722,400 | $855,000 | $867,400 |
| 2020 | $9,060 | $1,722,400 | $855,000 | $867,400 |
| 2019 | $8,784 | $1,722,400 | $855,000 | $867,400 |
| 2018 | $8,405 | $1,722,400 | $855,000 | $867,400 |
| 2017 | $7,674 | $1,380,200 | $618,800 | $761,400 |
| 2016 | $7,591 | $1,380,200 | $618,800 | $761,400 |
| 2015 | $7,467 | $1,380,200 | $618,800 | $761,400 |
| 2014 | $7,384 | $1,367,300 | $618,800 | $748,500 |
Source: Public Records
Map
Nearby Homes