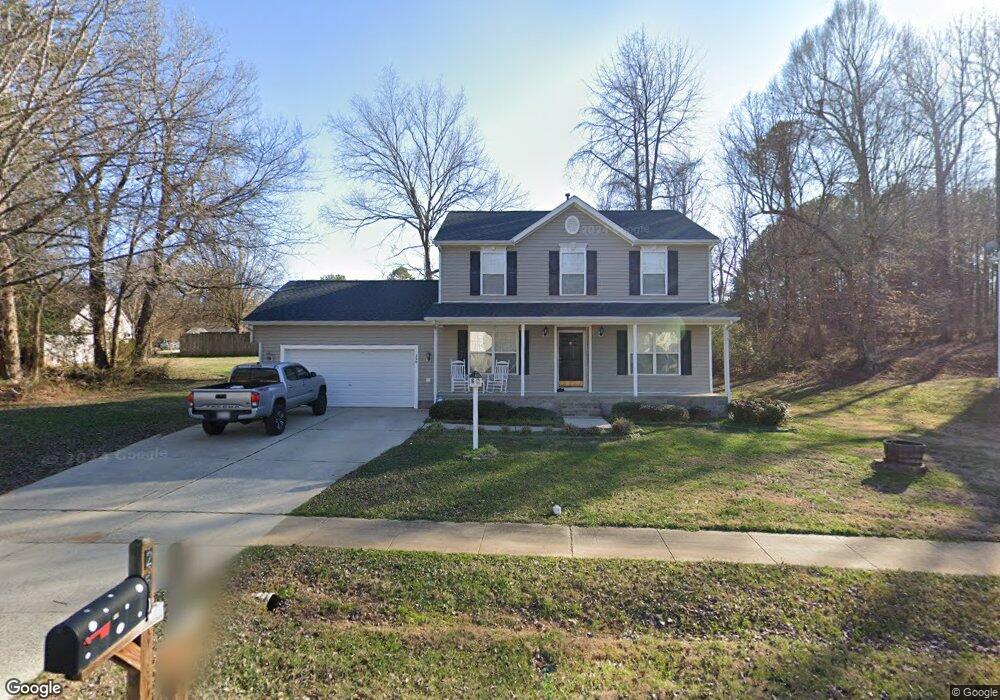
250 Churchwood Ln Pittsboro, NC 27312
Estimated Value: $391,113 - $465,000
3
Beds
3
Baths
1,792
Sq Ft
$233/Sq Ft
Est. Value
About This Home
This home is located at 250 Churchwood Ln, Pittsboro, NC 27312 and is currently estimated at $418,028, approximately $233 per square foot. 250 Churchwood Ln is a home located in Chatham County with nearby schools including Pittsboro Elementary School, George Moses Horton Middle School, and Northwood High.
Ownership History
Date
Name
Owned For
Owner Type
Purchase Details
Closed on
Dec 28, 2021
Sold by
Webster Steven Douglas and Webster Resa L
Bought by
Howard Carrie Webster
Current Estimated Value
Purchase Details
Closed on
May 31, 2017
Sold by
Ellis Shorty Martin and Ellis Whitney Webster
Bought by
Howard Christian Dale and Howard Carrie Webster
Home Financials for this Owner
Home Financials are based on the most recent Mortgage that was taken out on this home.
Original Mortgage
$214,514
Outstanding Balance
$177,755
Interest Rate
3.97%
Mortgage Type
FHA
Estimated Equity
$240,273
Purchase Details
Closed on
Apr 16, 2010
Sold by
Dalrymple Andre Billy
Bought by
Webster Whitney Nicole and Ellis Shorty Martin
Home Financials for this Owner
Home Financials are based on the most recent Mortgage that was taken out on this home.
Original Mortgage
$172,000
Interest Rate
4.75%
Mortgage Type
New Conventional
Create a Home Valuation Report for This Property
The Home Valuation Report is an in-depth analysis detailing your home's value as well as a comparison with similar homes in the area
Home Values in the Area
Average Home Value in this Area
Purchase History
| Date | Buyer | Sale Price | Title Company |
|---|---|---|---|
| Howard Carrie Webster | -- | None Available | |
| Howard Christian Dale | $218,500 | None Available | |
| Webster Whitney Nicole | $172,000 | None Available |
Source: Public Records
Mortgage History
| Date | Status | Borrower | Loan Amount |
|---|---|---|---|
| Open | Howard Christian Dale | $214,514 | |
| Previous Owner | Webster Whitney Nicole | $172,000 |
Source: Public Records
Tax History Compared to Growth
Tax History
| Year | Tax Paid | Tax Assessment Tax Assessment Total Assessment is a certain percentage of the fair market value that is determined by local assessors to be the total taxable value of land and additions on the property. | Land | Improvement |
|---|---|---|---|---|
| 2025 | $3,904 | $351,834 | $56,652 | $295,182 |
| 2024 | $3,904 | $227,675 | $49,987 | $177,688 |
| 2023 | $2,887 | $227,675 | $49,987 | $177,688 |
| 2022 | $2,726 | $227,675 | $49,987 | $177,688 |
| 2021 | $2,701 | $227,675 | $49,987 | $177,688 |
| 2020 | $2,314 | $192,040 | $33,000 | $159,040 |
| 2019 | $2,304 | $192,040 | $33,000 | $159,040 |
| 2018 | $2,203 | $192,040 | $33,000 | $159,040 |
| 2017 | $2,203 | $192,040 | $33,000 | $159,040 |
| 2016 | $2,028 | $174,582 | $30,000 | $144,582 |
| 2015 | $2,007 | $174,582 | $30,000 | $144,582 |
| 2014 | $2,007 | $174,582 | $30,000 | $144,582 |
| 2013 | -- | $174,582 | $30,000 | $144,582 |
Source: Public Records
Map
Nearby Homes
- 0 Nc 87 Hwy Unit 2491586
- 15 Juniper Ct
- 000 Alston Chapel Rd
- 344 May Farm Rd
- 0 N Carolina 902
- 00 N Carolina 902
- 162 Gaines Trail
- 507 W Salisbury St
- 74 Brookridge Ct
- 66 Toomer Loop Rd
- 298 E Salisbury St
- 501 U S 15
- 248 Ashford Dr
- 425 Credle St
- 88 Daisy Scurlock Rd
- Tbd Versailles Ln
- 726 Thompson St
- 230 Oakwood Dr
- 24 Cynthia Ln
- 25 Juleann Ln
- 238 Churchwood Ln
- 266 Churchwood Ln
- 59 Burnice Place
- 47 Burnice Place
- 73 Burnice Place
- 259 Churchwood Ln
- 178 Churchwood Ln
- 37 Burnice Place
- 249 Churchwood Ln
- 282 Churchwood Ln
- Lots 1 & 2 Churchwood Ln
- Lot 1 Churchwood Ln
- Lot 2 Churchwood Ln
- B Churchwood Ln
- A Churchwood Ln
- 283 Churchwood Ln
- 91 Burnice Place
- 70 Commons Path
- 70 Burnice Place
- 296 Churchwood Ln