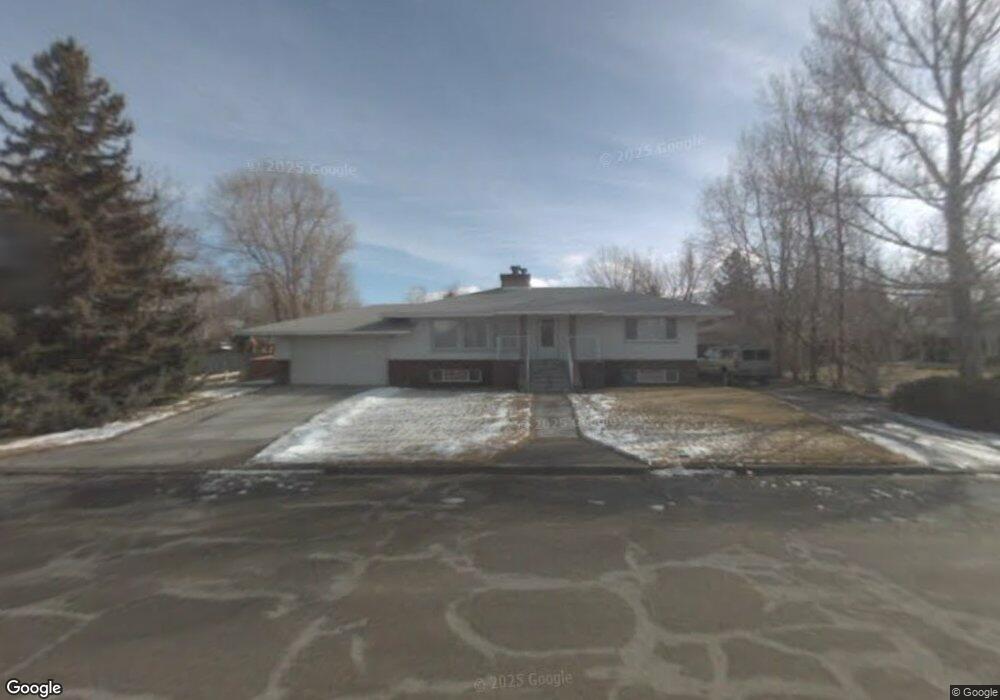
250 E Minor St Winnemucca, NV 89445
Estimated Value: $361,237 - $445,000
3
Beds
2
Baths
1,144
Sq Ft
$341/Sq Ft
Est. Value
About This Home
This home is located at 250 E Minor St, Winnemucca, NV 89445 and is currently estimated at $390,559, approximately $341 per square foot. 250 E Minor St is a home located in Humboldt County with nearby schools including Sonoma Heights Elementary School, French Ford Middle School, and Winnemucca Junior High School.
Ownership History
Date
Name
Owned For
Owner Type
Purchase Details
Closed on
Apr 4, 2023
Sold by
Weber James Mitchell
Bought by
Weber James Mitchell and Weber Alexis Marie
Current Estimated Value
Purchase Details
Closed on
Aug 3, 2021
Sold by
Weber Alexis
Bought by
Weber James Mitchell
Home Financials for this Owner
Home Financials are based on the most recent Mortgage that was taken out on this home.
Original Mortgage
$240,000
Interest Rate
2.8%
Purchase Details
Closed on
Dec 22, 2014
Sold by
Cornforth Earl and Cornforth Mary Jane
Bought by
Carlson Mark F
Home Financials for this Owner
Home Financials are based on the most recent Mortgage that was taken out on this home.
Original Mortgage
$203,500
Interest Rate
3.75%
Mortgage Type
New Conventional
Create a Home Valuation Report for This Property
The Home Valuation Report is an in-depth analysis detailing your home's value as well as a comparison with similar homes in the area
Home Values in the Area
Average Home Value in this Area
Purchase History
| Date | Buyer | Sale Price | Title Company |
|---|---|---|---|
| Weber James Mitchell | -- | None Listed On Document | |
| Weber James Mitchell | $300,000 | Stewart Title Co | |
| Weber James Mitchell | $300,000 | Stewart Title Co | |
| Carlson Mark F | $218,500 | First American Title Ins Co |
Source: Public Records
Mortgage History
| Date | Status | Borrower | Loan Amount |
|---|---|---|---|
| Previous Owner | Weber James Mitchell | $240,000 | |
| Previous Owner | Carlson Mark F | $203,500 |
Source: Public Records
Tax History Compared to Growth
Tax History
| Year | Tax Paid | Tax Assessment Tax Assessment Total Assessment is a certain percentage of the fair market value that is determined by local assessors to be the total taxable value of land and additions on the property. | Land | Improvement |
|---|---|---|---|---|
| 2025 | $1,509 | $45,828 | $14,000 | $31,828 |
| 2024 | $1,436 | $45,737 | $14,000 | $31,736 |
| 2023 | $1,436 | $35,635 | $10,675 | $24,960 |
| 2022 | $1,129 | $32,185 | $10,675 | $21,510 |
| 2021 | $1,092 | $31,040 | $10,675 | $20,365 |
| 2020 | $1,068 | $30,813 | $10,675 | $20,138 |
| 2019 | $1,040 | $29,731 | $10,675 | $19,056 |
| 2018 | $1,012 | $28,517 | $10,675 | $17,842 |
| 2017 | $1,007 | $28,336 | $10,675 | $17,661 |
| 2016 | $1,000 | $27,798 | $10,675 | $17,123 |
| 2015 | $1,158 | $27,461 | $10,675 | $16,786 |
| 2014 | $1,158 | $26,889 | $10,675 | $16,214 |
Source: Public Records
Map
Nearby Homes
- 45 Julie Ct
- 0 Julie Ct
- 20 Julie Ct
- 253 N Highland Dr
- 1385 S Bridge St
- 3200 Kensington Dr
- TBD E Haskell St
- 240 Circle Dr
- 121 W Shepard St
- 134 W Shepard St
- 5270 Marla Dr Unit 14
- 10-0149-02 Kluncy Canyon Rd
- 539 S Bridge St
- 273 Mccoy St
- 0 4th St Unit 230000686
- 502 Prebble St
- 702 W Mcarthur Ave Unit 56
- 702 W Mcarthur Ave Unit 82
- 5198 Western Way
- 3 Colado Ct
- 230 E Minor St
- 260 E Minor St
- 1521 Mizpah St
- 270 E Minor St
- 260 Parkview Ave
- 250 Parkview Ave
- 252 Parkview Ave
- 1575 Mizpah St
- 280 E Minor St
- 270 Parkview Ave
- 1518 Mizpah St
- 1528 Mizpah St
- 15 Julie Ct
- 1550 Mizpah St
- 280 Parkview Ave
- 25 Julie Ct
- 35 Julie Ct
- 170 E Minor St
- 1564 Mizpah St
- 290 E Minor St