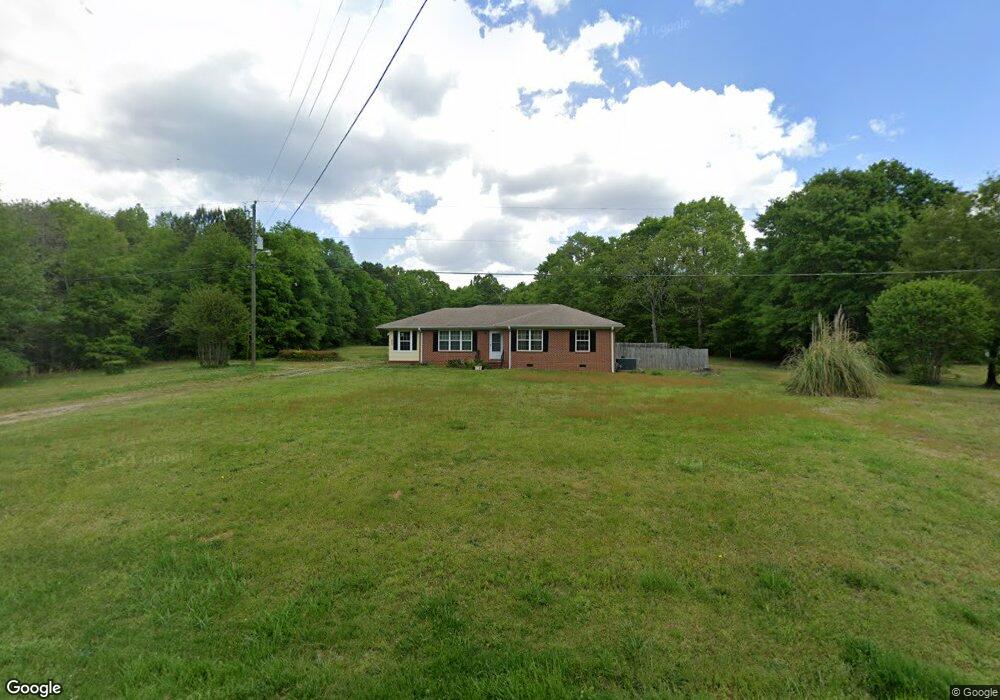
250 E Wright St Winder, GA 30680
Estimated Value: $289,455 - $309,000
3
Beds
1
Bath
1,696
Sq Ft
$177/Sq Ft
Est. Value
About This Home
This home is located at 250 E Wright St, Winder, GA 30680 and is currently estimated at $300,864, approximately $177 per square foot. 250 E Wright St is a home located in Barrow County with nearby schools including Holsenbeck Elementary School, Bear Creek Middle School, and Winder-Barrow High School.
Ownership History
Date
Name
Owned For
Owner Type
Purchase Details
Closed on
Mar 8, 2017
Sold by
Brown Shelia
Bought by
Brown Wayne
Current Estimated Value
Purchase Details
Closed on
May 31, 2011
Sold by
Hud-Housing Of Urban Dev
Bought by
Brown Sheila and Brown Wayne
Purchase Details
Closed on
Sep 7, 2010
Sold by
Branch Bkng & Trust Co
Bought by
Hud-Housing Of Urban Dev
Purchase Details
Closed on
Mar 1, 1999
Sold by
Ritzert Theresa
Bought by
Alloway James E
Home Financials for this Owner
Home Financials are based on the most recent Mortgage that was taken out on this home.
Original Mortgage
$89,162
Interest Rate
6.73%
Mortgage Type
New Conventional
Purchase Details
Closed on
Oct 13, 1998
Sold by
Ritzert Bryan and Ritzert Ther
Bought by
Ritzert Theresa
Purchase Details
Closed on
Jul 1, 1987
Bought by
Ritzert Bryan And
Create a Home Valuation Report for This Property
The Home Valuation Report is an in-depth analysis detailing your home's value as well as a comparison with similar homes in the area
Home Values in the Area
Average Home Value in this Area
Purchase History
| Date | Buyer | Sale Price | Title Company |
|---|---|---|---|
| Brown Wayne | -- | -- | |
| Brown Sheila | -- | -- | |
| Hud-Housing Of Urban Dev | -- | -- | |
| Branch Bkng & Trust Co | $105,325 | -- | |
| Secretary Of Housing And Urban Dev | $105,300 | -- | |
| Alloway James E | $89,900 | -- | |
| Ritzert Theresa | -- | -- | |
| Ritzert Bryan And | $68,400 | -- |
Source: Public Records
Mortgage History
| Date | Status | Borrower | Loan Amount |
|---|---|---|---|
| Previous Owner | Alloway James E | $89,162 |
Source: Public Records
Tax History
| Year | Tax Paid | Tax Assessment Tax Assessment Total Assessment is a certain percentage of the fair market value that is determined by local assessors to be the total taxable value of land and additions on the property. | Land | Improvement |
|---|---|---|---|---|
| 2025 | $1,785 | $73,295 | $16,193 | $57,102 |
| 2024 | $1,779 | $71,544 | $16,193 | $55,351 |
| 2023 | $1,770 | $71,544 | $16,193 | $55,351 |
| 2022 | $1,383 | $47,705 | $16,193 | $31,512 |
| 2021 | $1,287 | $42,032 | $12,954 | $29,078 |
| 2020 | $1,363 | $44,430 | $15,352 | $29,078 |
| 2019 | $1,278 | $40,836 | $15,352 | $25,484 |
| 2018 | $1,259 | $40,836 | $15,352 | $25,484 |
| 2017 | $1,065 | $36,564 | $15,352 | $21,212 |
| 2016 | $171 | $36,564 | $15,352 | $21,212 |
| 2015 | $172 | $36,564 | $15,352 | $21,212 |
| 2014 | $112 | $28,734 | $7,522 | $21,212 |
| 2013 | -- | $27,410 | $7,522 | $19,888 |
Source: Public Records
Map
Nearby Homes
- 92 Chase Cir
- 252 Eastbrook Dr
- 39 Huckleberry Ln
- 295 E Wright St
- 31 Huckleberry Ln
- 337 Mary Alice Dr
- 211 Brooks Ln
- 24 Lays Ln
- 403 Corinth Church Rd
- 208 Shields St
- 227 Martin Luther King jr Dr
- 221 Martin Luther King jr Dr
- 72 Shoal Ct
- 74 Shoal Ct
- 76 Shoal Ct
- 260 Westlyn Way
- 616 Embassy Walk
- 414 Grayson Dr
- 184 Capitol Ave
- 596 Embassy Walk
- 256 E Wright St
- E E Wright St Unit 32
- E E Wright St Unit 39
- E E Wright St Unit 25
- E E Wright St Unit B
- E E Wright St Unit 5B
- E E Wright St Unit A
- E E Wright St Unit 49 & 50
- E E Wright St Unit 37 & 38
- E E Wright St Unit 5 SETS EMAIL FOR DET
- E E Wright St Unit 63,63
- E E Wright St Unit 53-54
- E E Wright St Unit 20
- E E Wright St Unit 69
- E E Wright St Unit 15
- E E Wright St Unit 16
- E E Wright St Unit 38
- E E Wright St Unit 17
- E E Wright St Unit 36
- E E Wright St Unit 18
Your Personal Tour Guide
Ask me questions while you tour the home.