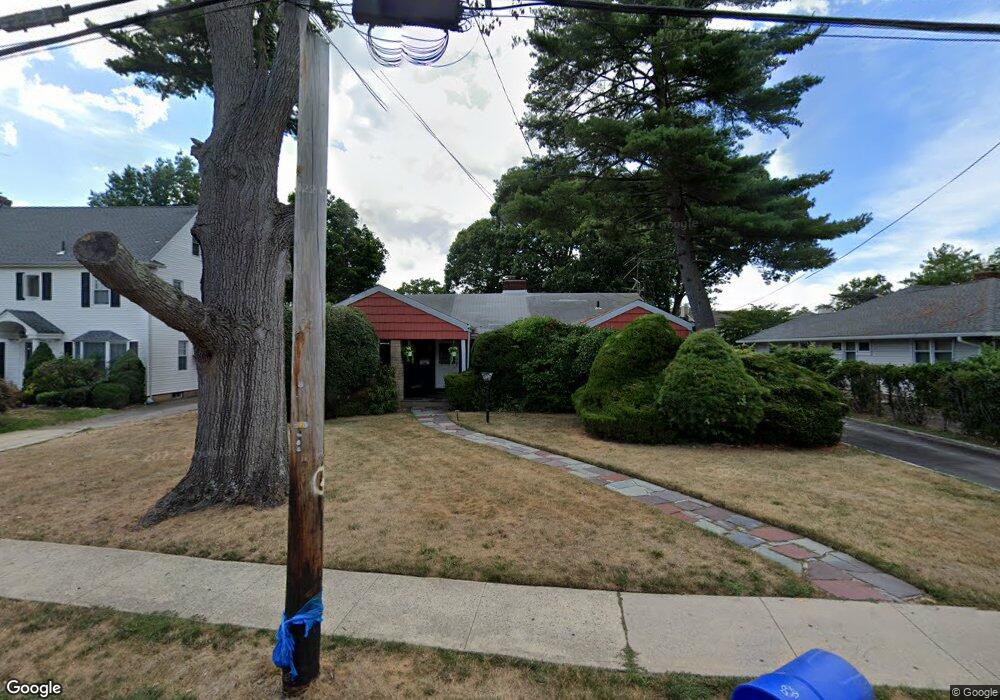
250 Fletcher Ave Valley Stream, NY 11580
Estimated Value: $765,000 - $943,407
4
Beds
3
Baths
1,900
Sq Ft
$450/Sq Ft
Est. Value
About This Home
This home is located at 250 Fletcher Ave, Valley Stream, NY 11580 and is currently estimated at $854,204, approximately $449 per square foot. 250 Fletcher Ave is a home located in Nassau County with nearby schools including Cheder at the Ohel, Valley Stream Christian Academy, and Martin De Porres High School.
Ownership History
Date
Name
Owned For
Owner Type
Purchase Details
Closed on
Oct 1, 2015
Sold by
Chang Simon and Dewing Samuel
Bought by
Bachan Eranie
Current Estimated Value
Home Financials for this Owner
Home Financials are based on the most recent Mortgage that was taken out on this home.
Original Mortgage
$439,814
Outstanding Balance
$349,402
Interest Rate
4.25%
Mortgage Type
FHA
Estimated Equity
$504,802
Create a Home Valuation Report for This Property
The Home Valuation Report is an in-depth analysis detailing your home's value as well as a comparison with similar homes in the area
Home Values in the Area
Average Home Value in this Area
Purchase History
| Date | Buyer | Sale Price | Title Company |
|---|---|---|---|
| Bachan Eranie | -- | The Judicial Title Insurance | |
| Bachan Eranie | -- | The Judicial Title Insurance | |
| Bachan Eranie | -- | The Judicial Title Insurance |
Source: Public Records
Mortgage History
| Date | Status | Borrower | Loan Amount |
|---|---|---|---|
| Open | Bachan Eranie | $439,814 | |
| Closed | Bachan Eranie | $439,814 |
Source: Public Records
Tax History Compared to Growth
Tax History
| Year | Tax Paid | Tax Assessment Tax Assessment Total Assessment is a certain percentage of the fair market value that is determined by local assessors to be the total taxable value of land and additions on the property. | Land | Improvement |
|---|---|---|---|---|
| 2025 | $11,818 | $617 | $283 | $334 |
| 2024 | $2,350 | $617 | $283 | $334 |
| 2023 | $11,020 | $617 | $283 | $334 |
| 2022 | $11,020 | $617 | $283 | $334 |
| 2021 | $14,983 | $591 | $271 | $320 |
| 2020 | $11,113 | $702 | $368 | $334 |
| 2019 | $9,880 | $702 | $368 | $334 |
| 2018 | $9,359 | $1,121 | $0 | $0 |
| 2017 | $11,025 | $1,121 | $588 | $533 |
| 2016 | $13,584 | $1,121 | $588 | $533 |
| 2015 | $1,676 | $1,121 | $588 | $533 |
| 2014 | $1,676 | $1,121 | $588 | $533 |
| 2013 | $1,659 | $1,121 | $588 | $533 |
Source: Public Records
Map
Nearby Homes