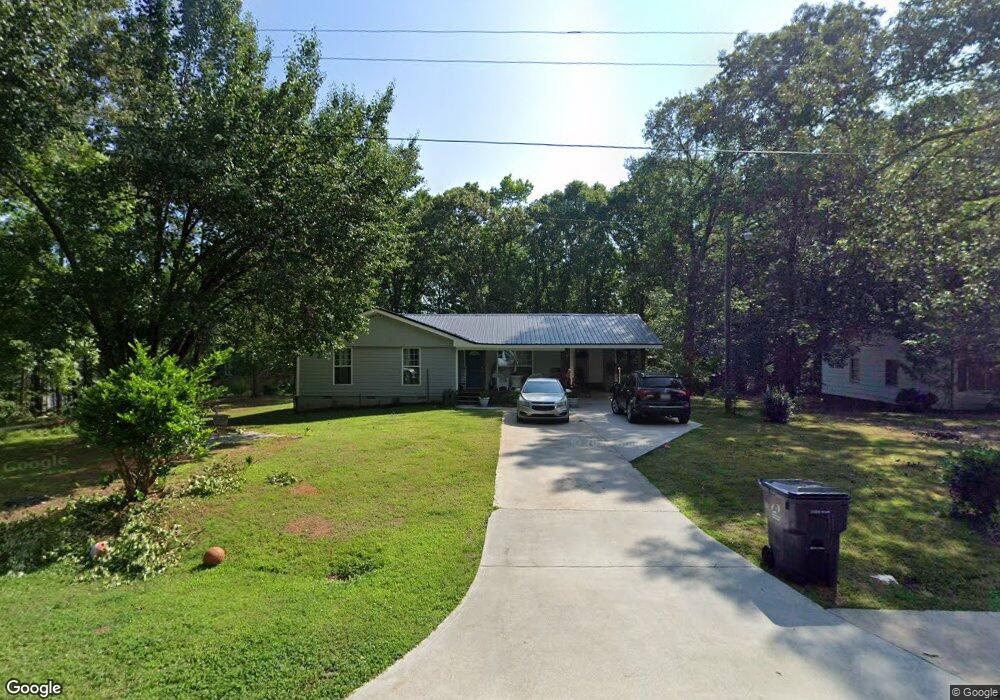
250 Hollis St Rutledge, GA 30663
Estimated Value: $220,493 - $298,000
3
Beds
2
Baths
1,365
Sq Ft
$184/Sq Ft
Est. Value
About This Home
This home is located at 250 Hollis St, Rutledge, GA 30663 and is currently estimated at $251,123, approximately $183 per square foot. 250 Hollis St is a home located in Morgan County with nearby schools including Morgan County Primary School, Morgan County Elementary School, and Morgan County Middle School.
Ownership History
Date
Name
Owned For
Owner Type
Purchase Details
Closed on
Apr 30, 2021
Sold by
Head Samuel
Bought by
Ross Katilya Imani
Current Estimated Value
Home Financials for this Owner
Home Financials are based on the most recent Mortgage that was taken out on this home.
Original Mortgage
$149,737
Outstanding Balance
$134,830
Interest Rate
3.1%
Mortgage Type
FHA
Estimated Equity
$116,293
Purchase Details
Closed on
Feb 7, 2007
Sold by
Federal National Mortgage Association
Bought by
Head Samuel
Home Financials for this Owner
Home Financials are based on the most recent Mortgage that was taken out on this home.
Original Mortgage
$58,860
Interest Rate
6.88%
Mortgage Type
New Conventional
Purchase Details
Closed on
Nov 7, 2006
Sold by
Countrywide Home Loans Inc
Bought by
Federal National Mtg Associati
Purchase Details
Closed on
Mar 31, 1978
Sold by
Briney Ezell
Bought by
Briney Rachel M
Create a Home Valuation Report for This Property
The Home Valuation Report is an in-depth analysis detailing your home's value as well as a comparison with similar homes in the area
Home Values in the Area
Average Home Value in this Area
Purchase History
| Date | Buyer | Sale Price | Title Company |
|---|---|---|---|
| Ross Katilya Imani | $152,500 | -- | |
| Head Samuel | $65,400 | -- | |
| Federal National Mtg Associati | -- | -- | |
| Countrywide Home Loans Inc | -- | -- | |
| Briney Rachel M | -- | -- |
Source: Public Records
Mortgage History
| Date | Status | Borrower | Loan Amount |
|---|---|---|---|
| Open | Ross Katilya Imani | $149,737 | |
| Previous Owner | Head Samuel | $58,860 |
Source: Public Records
Tax History Compared to Growth
Tax History
| Year | Tax Paid | Tax Assessment Tax Assessment Total Assessment is a certain percentage of the fair market value that is determined by local assessors to be the total taxable value of land and additions on the property. | Land | Improvement |
|---|---|---|---|---|
| 2025 | $1,904 | $74,985 | $5,600 | $69,385 |
| 2024 | $1,769 | $68,577 | $4,800 | $63,777 |
| 2023 | $1,567 | $60,654 | $3,200 | $57,454 |
| 2022 | $1,533 | $57,188 | $2,800 | $54,388 |
| 2021 | $904 | $32,536 | $2,400 | $30,136 |
| 2020 | $273 | $9,739 | $2,400 | $7,339 |
| 2019 | $1,021 | $35,833 | $2,400 | $33,433 |
| 2018 | $1,035 | $35,833 | $2,400 | $33,433 |
| 2017 | $1,014 | $34,590 | $2,400 | $32,190 |
| 2016 | $910 | $30,232 | $2,400 | $27,832 |
| 2015 | $922 | $30,200 | $2,400 | $27,800 |
| 2014 | $694 | $23,280 | $2,400 | $20,880 |
| 2013 | -- | $18,920 | $2,400 | $16,520 |
Source: Public Records
Map
Nearby Homes
- 224 Hollis St
- 120 Hidden Falls Ct
- 0 Fairplay St Unit 10637174
- 0 Hawkins Academy Rd Unit 10561655
- 5761 W Dixie Hwy
- 5521 Atlanta Hwy
- 294 Tuscany Dr
- 0 Reese Rd Unit 10622381
- 0 Reese Rd Unit 25651133
- 5841 Atlanta Hwy
- 0 W Dixie Hwy Unit 10499573
- 5187 Parkview Rd
- 1151 Fears Rd
- 25 Browning Shoals Rd
- 745 Amber Lakes Ct Unit 2
- 3641 Davis Academy Rd
- 1310 Knox Chapel Rd
- 2535 Willow Ln
- 0 Browning Shoals Rd Unit 7392331
- 0 Browning Shoals Rd Unit TRACT 1A & 1B
- 242 Hollis St
- 171 Shoals Creek Lot 28
- 171 Shoals Creek Ln
- 171 Shoals Creek Ln Unit Lot 28
- 241 Hollis St
- 236 Hollis St
- 181 Shoals Creek Ln Unit 27
- 235 Hollis St
- 231 Hollis St
- 230 Hollis St
- 225 Hollis St
- 151 Shoals Creek Ln
- 180 Shoals Creek Ln
- 120 Hidden Falls Ct Unit 31
- 221 Hollis St
- 220 Hollis St
- 215 Hollis St
- 140 Shoals Creek Ln
- 216 Hollis St
- 211 Hollis St