250 June Ct Hayward, CA 94541
Estimated Value: $538,130 - $601,000
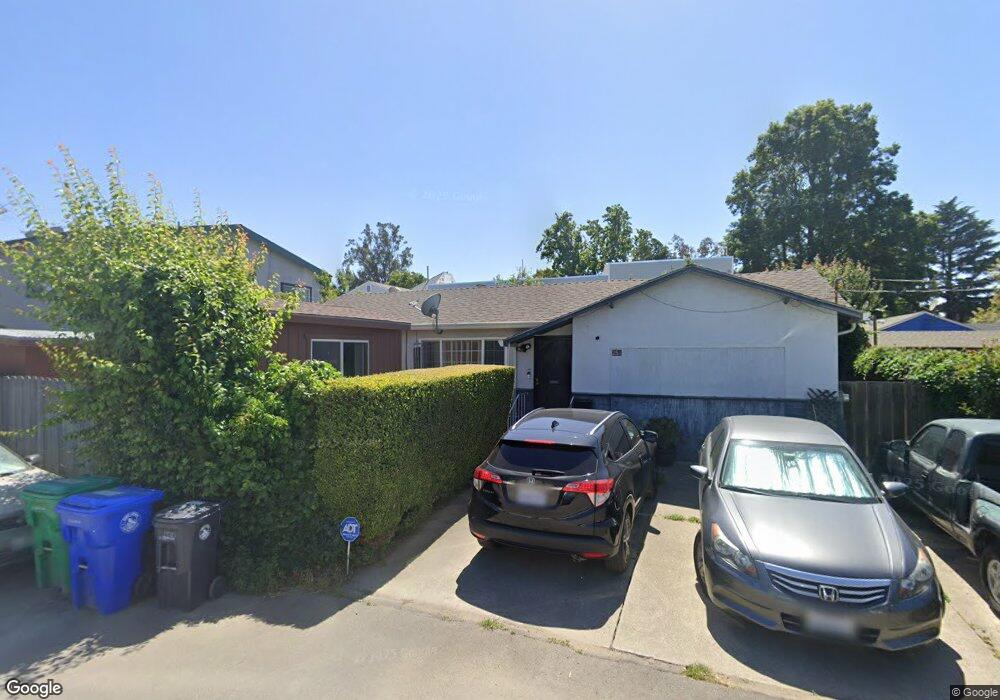
About This Home
This home is located at 250 June Ct, Hayward, CA 94541 and is currently estimated at $563,783, approximately $883 per square foot. 250 June Ct is a home located in Alameda County with nearby schools including Winton Middle School, Hayward High School, and St. John Catholic School.
Ownership History
We collect this data history from publicly available records. To have your information removed, we recommend requesting removal directly through your county’s website.
Purchase Details
Purchase Details
Home Financials for this Owner
Home Financials are based on the most recent Mortgage that was taken out on this home.Home Values in the Area
Average Home Value in this Area
Purchase History
We collect this data history from publicly available records. To have your information removed, we recommend requesting removal directly through your county’s website.
| Date | Buyer | Sale Price | Title Company |
|---|---|---|---|
| -- | None Available | ||
| -- | Old Republic Title Company |
Mortgage History
We collect this data history from publicly available records. To have your information removed, we recommend requesting removal directly through your county’s website.
| Date | Status | Borrower | Loan Amount |
|---|---|---|---|
| Closed | $123,300 |
Tax History
We collect this data history from publicly available records. To have your information removed, we recommend requesting removal directly through your county’s website.
| Year | Tax Paid | Tax Assessment Tax Assessment Total Assessment is a certain percentage of the fair market value that is determined by local assessors to be the total taxable value of land and additions on the property. | Land | Improvement |
|---|---|---|---|---|
| 2025 | $2,988 | $187,273 | $58,377 | $135,896 |
| 2024 | $2,988 | $183,464 | $57,233 | $133,231 |
| 2023 | $2,975 | $186,730 | $56,111 | $130,619 |
| 2022 | $2,895 | $176,069 | $55,011 | $128,058 |
| 2021 | $2,843 | $172,479 | $53,932 | $125,547 |
| 2020 | $2,783 | $177,639 | $53,379 | $124,260 |
| 2019 | $2,777 | $174,157 | $52,333 | $121,824 |
| 2018 | $2,620 | $170,743 | $51,307 | $119,436 |
| 2017 | $2,553 | $167,395 | $50,301 | $117,094 |
| 2016 | $2,391 | $164,114 | $49,315 | $114,799 |
| 2015 | $2,337 | $161,649 | $48,574 | $113,075 |
| 2014 | $2,235 | $158,483 | $47,623 | $110,860 |
Map
- 20667 Blossom Common
- 20923 Haviland Ave
- 148 Anderly Ct Unit 6
- 188 Sunset Blvd
- 752 Blossom Way
- 155 Sunset Blvd
- 10 Leighty Ct Unit 5
- 592 Willow Ave
- 20753 Agnes Ln
- 19671 Medford Cir Unit 22
- 21617 Westfield Ave
- 21335 Hathaway Ave
- 19762 Hathaway Ave
- 257 Poplar Ave
- 330 Falgren Ave
- 19034 Western Blvd
- 554 Hampton Rd
- 18407 Rainier Ave
- 18183 Rainier Ave
- 591 W Sunset Blvd
Ask me questions while you tour the home.