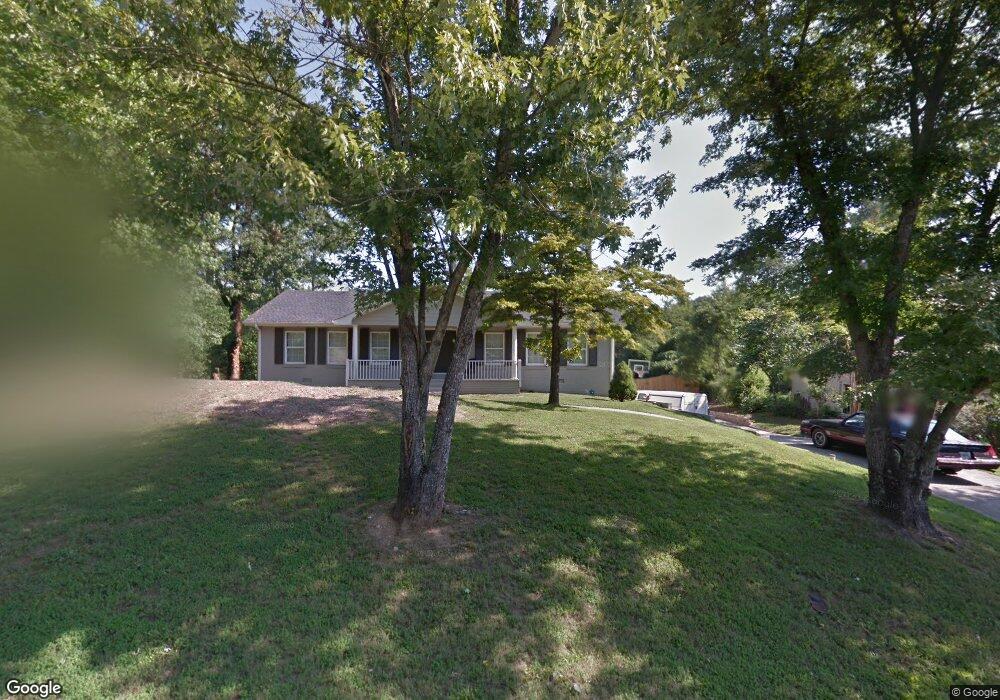
250 Moonshadow Ct Unit 12 Roswell, GA 30075
Estimated Value: $550,000 - $617,000
3
Beds
2
Baths
1,643
Sq Ft
$352/Sq Ft
Est. Value
About This Home
This home is located at 250 Moonshadow Ct Unit 12, Roswell, GA 30075 and is currently estimated at $579,157, approximately $352 per square foot. 250 Moonshadow Ct Unit 12 is a home located in Fulton County with nearby schools including Roswell North Elementary School, Crabapple Middle School, and Roswell High School.
Ownership History
Date
Name
Owned For
Owner Type
Purchase Details
Closed on
Apr 8, 2014
Sold by
Mwk Rehabs Llc
Bought by
Stewart Linda K
Current Estimated Value
Purchase Details
Closed on
Jan 10, 2014
Sold by
Scabis Joseph B
Bought by
Mwk Rehabs Llc
Purchase Details
Closed on
Apr 9, 2010
Sold by
Popular Abs Inc Series 2007 & A
Bought by
Scabis Joseph B and Froid Marjean
Home Financials for this Owner
Home Financials are based on the most recent Mortgage that was taken out on this home.
Original Mortgage
$171,830
Interest Rate
5.25%
Mortgage Type
FHA
Purchase Details
Closed on
Oct 6, 2009
Sold by
Martinez-Hernandez Naidelinne
Bought by
Lenders Other Instl
Purchase Details
Closed on
Aug 28, 2003
Sold by
Lee Myung G
Bought by
Hernandez Naidelinne M
Home Financials for this Owner
Home Financials are based on the most recent Mortgage that was taken out on this home.
Original Mortgage
$165,000
Interest Rate
5.94%
Mortgage Type
New Conventional
Create a Home Valuation Report for This Property
The Home Valuation Report is an in-depth analysis detailing your home's value as well as a comparison with similar homes in the area
Home Values in the Area
Average Home Value in this Area
Purchase History
| Date | Buyer | Sale Price | Title Company |
|---|---|---|---|
| Stewart Linda K | $245,000 | -- | |
| Mwk Rehabs Llc | $173,476 | -- | |
| Scabis Joseph B | $175,000 | -- | |
| Lenders Other Instl | $140,000 | -- | |
| Hernandez Naidelinne M | $165,000 | -- |
Source: Public Records
Mortgage History
| Date | Status | Borrower | Loan Amount |
|---|---|---|---|
| Previous Owner | Scabis Joseph B | $171,830 | |
| Previous Owner | Hernandez Naidelinne M | $165,000 |
Source: Public Records
Tax History Compared to Growth
Tax History
| Year | Tax Paid | Tax Assessment Tax Assessment Total Assessment is a certain percentage of the fair market value that is determined by local assessors to be the total taxable value of land and additions on the property. | Land | Improvement |
|---|---|---|---|---|
| 2025 | $1,102 | $207,480 | $33,280 | $174,200 |
| 2023 | $5,970 | $211,520 | $62,000 | $149,520 |
| 2022 | $4,934 | $187,520 | $51,640 | $135,880 |
| 2021 | $4,873 | $153,000 | $33,320 | $119,680 |
| 2020 | $4,738 | $144,680 | $21,440 | $123,240 |
| 2019 | $717 | $144,760 | $22,560 | $122,200 |
| 2018 | $3,990 | $141,360 | $22,040 | $119,320 |
| 2017 | $2,858 | $97,972 | $19,652 | $78,320 |
| 2016 | $2,859 | $97,970 | $19,650 | $78,320 |
| 2015 | $3,405 | $97,970 | $19,650 | $78,320 |
| 2014 | $2,610 | $85,160 | $19,640 | $65,520 |
Source: Public Records
Map
Nearby Homes
- 250 Moonshadow Ct
- 240 Moonshadow Ct Unit 1
- 260 Moonshadow Ct Unit 11
- 260 Moonshadow Ct
- 230 Corinth Ct
- 230 Moonshadow Ct Unit 1
- 245 Moonshadow Ct
- 220 Corinth Ct
- 240 Corinth Ct
- 255 Moonshadow Ct Unit 1
- 265 Moonshadow Ct Unit 1
- 235 Moonshadow Ct
- 235 Moonshadow Ct Unit 24
- 210 Corinth Ct
- 220 Moonshadow Ct Unit 1
- 10185 N Coleman Rd
- 1115 N Coleman Rd
- 225 Moonshadow Ct
- 275 Windflower Trace Unit 1
- 285 Windflower Trace