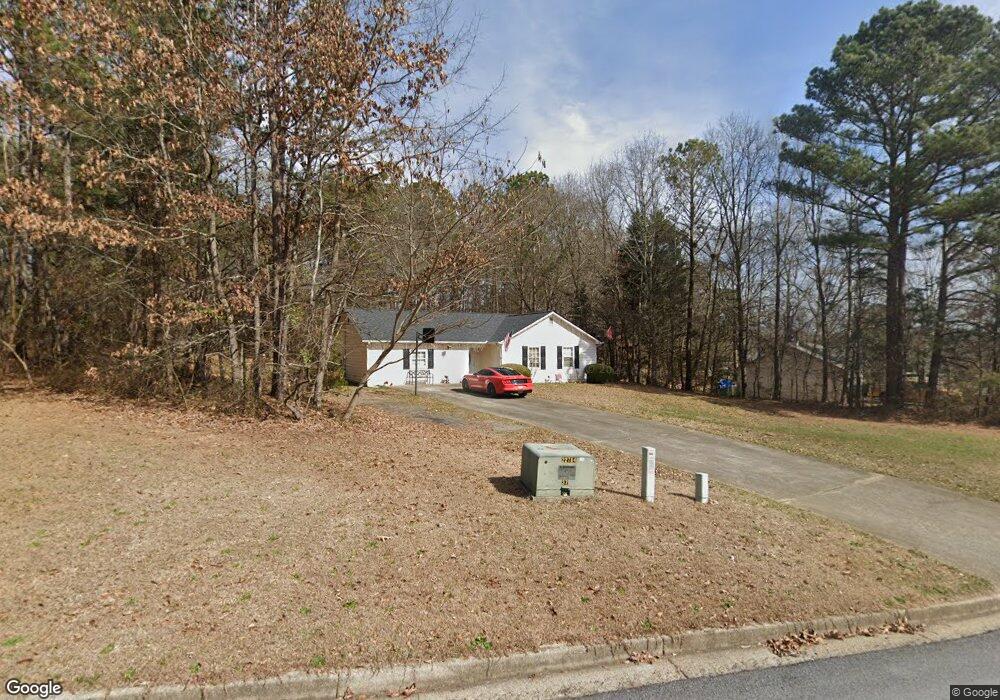
250 Myrtle Grove Ln Covington, GA 30014
Estimated Value: $229,000 - $280,698
3
Beds
2
Baths
1,581
Sq Ft
$162/Sq Ft
Est. Value
About This Home
This home is located at 250 Myrtle Grove Ln, Covington, GA 30014 and is currently estimated at $256,425, approximately $162 per square foot. 250 Myrtle Grove Ln is a home located in Newton County with nearby schools including Heard-Mixon Elementary School, Indian Creek Middle School, and Alcovy High School.
Ownership History
Date
Name
Owned For
Owner Type
Purchase Details
Closed on
Jul 31, 2017
Sold by
Bryant Jonathan
Bought by
Bryant Jonathan and May Vicki
Current Estimated Value
Purchase Details
Closed on
Aug 19, 2011
Sold by
Yang Jessica
Bought by
T J Yang Housing Llc
Purchase Details
Closed on
Feb 10, 2010
Sold by
Veterans Admn
Bought by
Yang Jessica
Purchase Details
Closed on
Oct 6, 2009
Sold by
Thompson Daniel L and Thompson Melissa R
Bought by
Veterans Admn
Purchase Details
Closed on
Aug 28, 2000
Sold by
Chase Manhattan Mtg Corp
Bought by
Thompson Melissa R and Thompson Daniel L
Home Financials for this Owner
Home Financials are based on the most recent Mortgage that was taken out on this home.
Original Mortgage
$82,000
Interest Rate
8.11%
Mortgage Type
New Conventional
Purchase Details
Closed on
Jun 9, 2000
Sold by
Delamar Richard P
Bought by
Chase Manhattan Mtg
Purchase Details
Closed on
Dec 23, 1996
Sold by
Weeks Constr
Bought by
Delamar Richard
Create a Home Valuation Report for This Property
The Home Valuation Report is an in-depth analysis detailing your home's value as well as a comparison with similar homes in the area
Home Values in the Area
Average Home Value in this Area
Purchase History
| Date | Buyer | Sale Price | Title Company |
|---|---|---|---|
| Bryant Jonathan | -- | -- | |
| T J Yang Housing Llc | $339,000 | -- | |
| Yang Jessica | $33,900 | -- | |
| Veterans Admn | $73,147 | -- | |
| Thompson Melissa R | $82,000 | -- | |
| Chase Manhattan Mtg | $78,000 | -- | |
| Delamar Richard | $75,900 | -- |
Source: Public Records
Mortgage History
| Date | Status | Borrower | Loan Amount |
|---|---|---|---|
| Previous Owner | Thompson Melissa R | $82,000 | |
| Closed | Delamar Richard | $0 |
Source: Public Records
Tax History Compared to Growth
Tax History
| Year | Tax Paid | Tax Assessment Tax Assessment Total Assessment is a certain percentage of the fair market value that is determined by local assessors to be the total taxable value of land and additions on the property. | Land | Improvement |
|---|---|---|---|---|
| 2024 | $2,635 | $106,600 | $13,600 | $93,000 |
| 2023 | $2,234 | $85,000 | $4,800 | $80,200 |
| 2022 | $1,984 | $75,800 | $4,800 | $71,000 |
| 2021 | $1,716 | $59,400 | $4,800 | $54,600 |
| 2020 | $1,317 | $42,160 | $4,800 | $37,360 |
| 2019 | $1,291 | $40,840 | $4,800 | $36,040 |
| 2018 | $1,209 | $38,200 | $4,800 | $33,400 |
| 2017 | $1,032 | $33,040 | $3,800 | $29,240 |
| 2016 | $867 | $24,360 | $3,800 | $20,560 |
| 2015 | $812 | $22,680 | $2,800 | $19,880 |
| 2014 | $809 | $22,680 | $0 | $0 |
Source: Public Records
Map
Nearby Homes
- 230 Myrtle Grove Ln
- 270 Myrtle Grove Ln
- 12421 Highway 36
- 55 Myrtle Grove Ln
- 85 Taylor Rd
- 12522 Georgia 36
- 270 Oak Ridge Rd
- 12895 Highway 36
- 219 Channing Cope Rd
- 0 Highway 36 Unit 10632443
- 330 King Bostick Rd
- 11489 Highway 36
- 590 King Bostick Rd
- 150 Alcovy Reserve Way
- 440 Varner St
- 90 Alcovy Reserve Way
- 645 5th Ave
- 70 Alcovy Reserve Way
- 60 Laurie Ln
- 0 Rocky Plains Rd Unit 18248418
- 260 Myrtle Grove Ln
- 220 Myrtle Grove Ln
- 255 Myrtle Grove Ln
- 265 Myrtle Grove Ln
- 265 Myrtle Grove Ln Unit 28
- 245 Myrtle Grove Ln
- 210 Myrtle Grove Ln
- 235 Myrtle Grove Ln
- 275 Myrtle Grove Ln
- 225 Myrtle Grove Ln
- 100 Myrtle Grove Ln
- 12289 Highway 36
- 215 Myrtle Grove Ln
- 90 Myrtle Grove Ln
- 80 Myrtle Grove Ln
- 120 Myrtle Grove Ln
- 70 Myrtle Grove Ln
- 205 Myrtle Grove Ln
- 130 Myrtle Grove Ln
- 140 Myrtle Grove Ln