


About This Home
This beautiful and spacious historic home in Kanab is available for rent January 1st, and it’s perfect for anyone who wants charm, character, and the flexibility to make a little extra income on the side.
Subletting is allowed, so the primary tenant can rent out the additional rooms! Whether you want to offset your rent or turn the space into your next mini business venture. This home is ideal for remote workers, creatives, students, groups of friends, or anyone looking for a unique space with income potential.
The house includes:
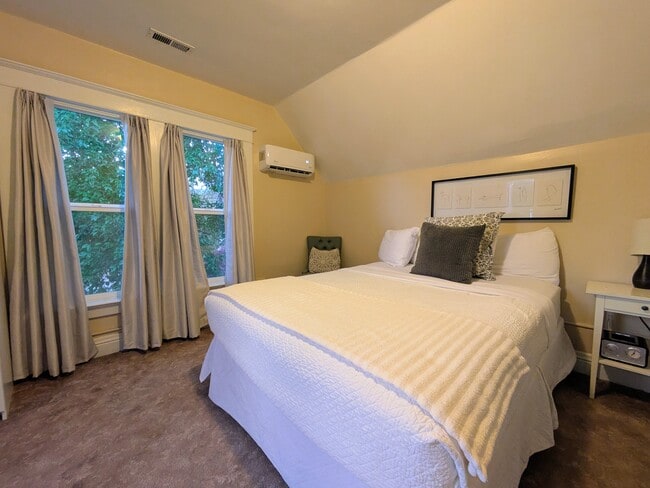
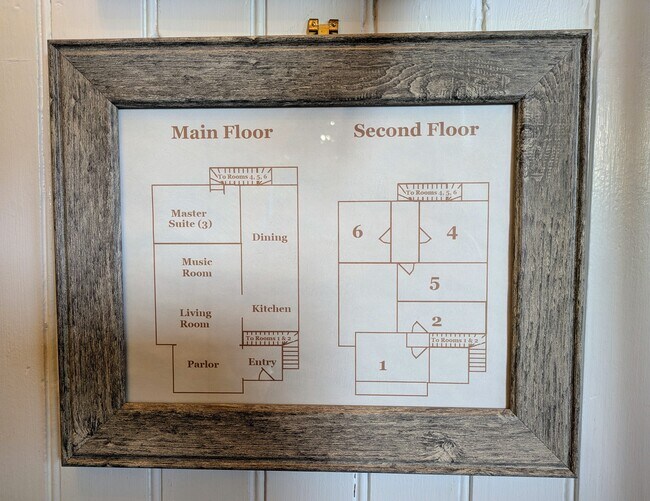
• 7 bedrooms, each with its own private ensuite bathroom
• Fully furnished
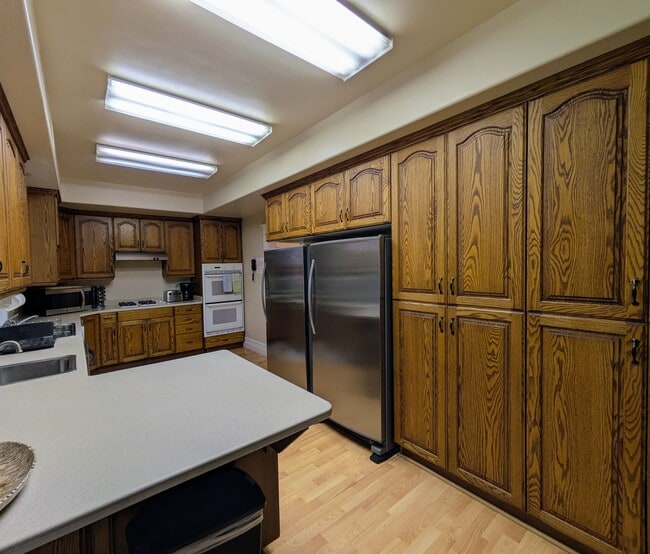
• A large kitchen, living room, and dining area
• Pet-friendly
• A spacious yard
• 7.5 total bathrooms
• Fully finished basement
• 3 washer/dryer sets

Map
Property History
| Date | Event | Price | List to Sale | Price per Sq Ft |
|---|---|---|---|---|
| 12/10/2025 12/10/25 | For Rent | $3,500 | -- | -- |
- 197 N 200 W
- 253 N 240 W Unit 4
- 163 N 200 W
- 75 N 200 W
- 65 & 75 200
- 163 E 200 N
- 0 200 Unit 1409069
- 23 S 100 E
- 233 E 100 N
- 0 250 E
- 143 E 100 S Unit 2
- 143 E 100 S Unit 1
- 176 S 100 E
- 513 Winchester Unit 351
- 513 Winchester
- Lot 350 Winchester
- 320 W Los Barancos Ln
- 190 W Ladera Ln
- 444 Ladera Ln
- 463 E Deadwood Dr