250 N 200 W Logan, UT 84321
Ellis NeighborhoodEstimated Value: $299,000 - $363,000
4
Beds
2
Baths
1,466
Sq Ft
$232/Sq Ft
Est. Value
About This Home
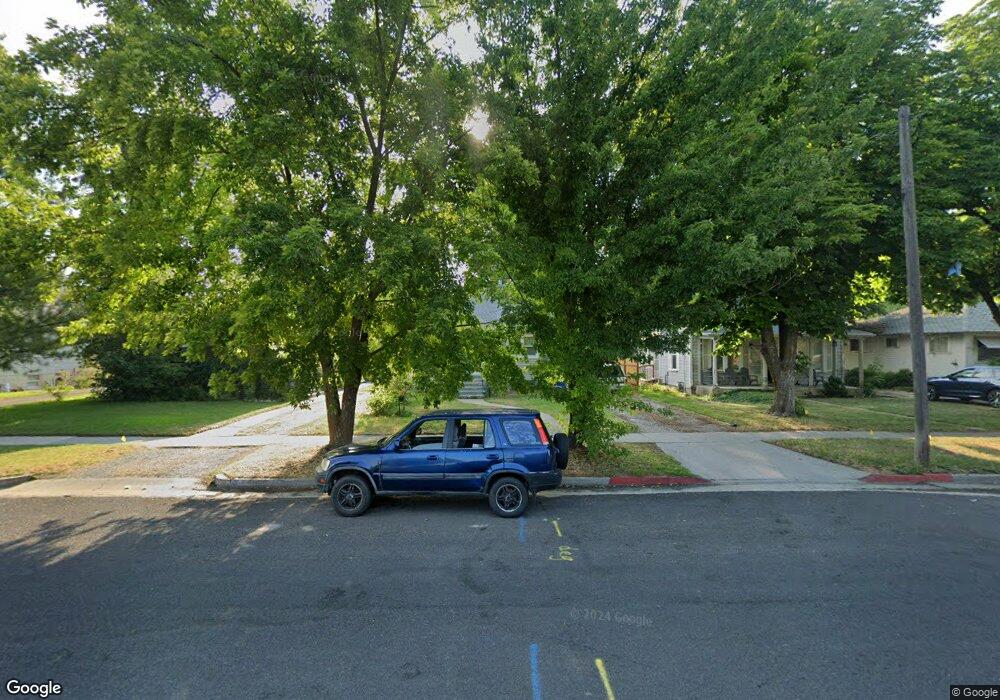
This home is located at 250 N 200 W, Logan, UT 84321 and is currently estimated at $339,916, approximately $231 per square foot. 250 N 200 W is a home located in Cache County with nearby schools including Ellis School, Mount Logan Middle School, and Logan High School.
Ownership History
Date
Name
Owned For
Owner Type
Purchase Details
Closed on
Aug 23, 2017
Sold by
Weight Ryan Mark and Weight Christina Elaine
Bought by
Blad Denny and Blad Haley
Current Estimated Value
Home Financials for this Owner
Home Financials are based on the most recent Mortgage that was taken out on this home.
Original Mortgage
$151,210
Outstanding Balance
$125,561
Interest Rate
3.87%
Mortgage Type
FHA
Estimated Equity
$214,355
Purchase Details
Closed on
Nov 8, 2011
Sold by
Fluckiger Travis B and Fluckiger Lorinda
Bought by
Weight Ryan Mark and Weight Christina Elaine
Home Financials for this Owner
Home Financials are based on the most recent Mortgage that was taken out on this home.
Original Mortgage
$107,211
Interest Rate
4.25%
Mortgage Type
FHA
Purchase Details
Closed on
Mar 14, 2001
Sold by
Fluckiger Travis B
Bought by
T B & R Enterprises
Purchase Details
Closed on
Feb 27, 2001
Sold by
T B & R Enterprises
Bought by
Fluckiger Travis B
Purchase Details
Closed on
Feb 1, 2001
Sold by
Fluckiger Brent H and Fluckiger Ruth J
Bought by
T B & R Enterprises
Create a Home Valuation Report for This Property
The Home Valuation Report is an in-depth analysis detailing your home's value as well as a comparison with similar homes in the area
Home Values in the Area
Average Home Value in this Area
Purchase History
| Date | Buyer | Sale Price | Title Company |
|---|---|---|---|
| Blad Denny | -- | Advanced Title Insurance | |
| Weight Ryan Mark | -- | Cache Title Company | |
| T B & R Enterprises | -- | -- | |
| Fluckiger Travis B | -- | -- | |
| T B & R Enterprises | -- | Hickman Land Title Company |
Source: Public Records
Mortgage History
| Date | Status | Borrower | Loan Amount |
|---|---|---|---|
| Open | Blad Denny | $151,210 | |
| Previous Owner | Weight Ryan Mark | $107,211 |
Source: Public Records
Tax History Compared to Growth
Tax History
| Year | Tax Paid | Tax Assessment Tax Assessment Total Assessment is a certain percentage of the fair market value that is determined by local assessors to be the total taxable value of land and additions on the property. | Land | Improvement |
|---|---|---|---|---|
| 2025 | $1,408 | $182,040 | $0 | $0 |
| 2024 | $145 | $181,335 | $0 | $0 |
| 2023 | $1,521 | $181,565 | $0 | $0 |
| 2022 | $1,611 | $179,620 | $0 | $0 |
| 2021 | $1,304 | $224,650 | $42,000 | $182,650 |
| 2020 | $1,177 | $182,500 | $42,000 | $140,500 |
| 2019 | $1,230 | $182,500 | $42,000 | $140,500 |
| 2018 | $873 | $118,272 | $42,000 | $76,272 |
| 2017 | $846 | $60,555 | $0 | $0 |
| 2016 | $877 | $60,555 | $0 | $0 |
| 2015 | $878 | $60,555 | $0 | $0 |
| 2014 | $794 | $60,555 | $0 | $0 |
| 2013 | -- | $59,675 | $0 | $0 |
Source: Public Records
Map
Nearby Homes