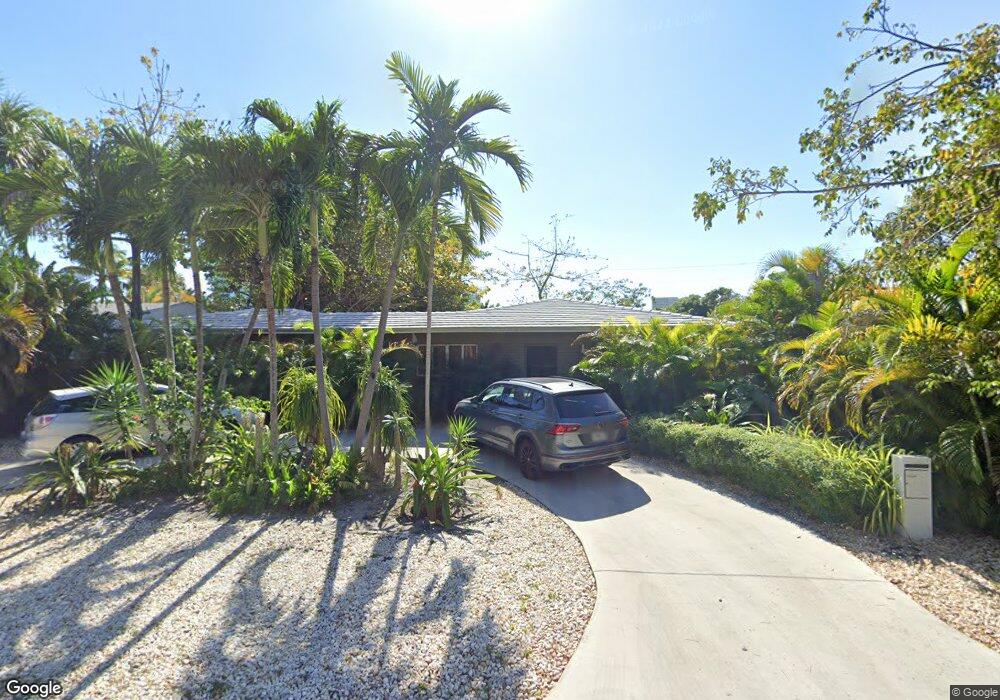
250 NE 47th St Miami, FL 33137
Little Haiti NeighborhoodEstimated Value: $979,829 - $1,435,000
3
Beds
2
Baths
1,862
Sq Ft
$606/Sq Ft
Est. Value
About This Home
This home is located at 250 NE 47th St, Miami, FL 33137 and is currently estimated at $1,127,707, approximately $605 per square foot. 250 NE 47th St is a home located in Miami-Dade County with nearby schools including Toussaint L'Ouverture Elementary, Jose De Diego Middle School, and Booker T. Washington Senior High School.
Ownership History
Date
Name
Owned For
Owner Type
Purchase Details
Closed on
Apr 4, 2025
Sold by
Yelin Anette and Irrevocable Trust For Max I Yelin
Bought by
Yelin Max I
Current Estimated Value
Purchase Details
Closed on
Nov 9, 2012
Sold by
Yelin Samuel and Yelin Eva
Bought by
Yelin Anette
Purchase Details
Closed on
Feb 12, 2003
Sold by
Diaz Irenaida
Bought by
Yelin Samuel and Yelin Eva
Purchase Details
Closed on
Jan 13, 2000
Sold by
Roque Estela C and Diaz Irenaida
Bought by
Diaz Irenaida
Purchase Details
Closed on
Oct 6, 1997
Sold by
Baggesen Donald F and Baggesen Pr
Bought by
Roque Estela C and Diaz Irenaida
Home Financials for this Owner
Home Financials are based on the most recent Mortgage that was taken out on this home.
Original Mortgage
$57,600
Interest Rate
7.46%
Mortgage Type
New Conventional
Create a Home Valuation Report for This Property
The Home Valuation Report is an in-depth analysis detailing your home's value as well as a comparison with similar homes in the area
Home Values in the Area
Average Home Value in this Area
Purchase History
| Date | Buyer | Sale Price | Title Company |
|---|---|---|---|
| Yelin Max I | -- | None Listed On Document | |
| Yelin Anette | $134,000 | Attorney | |
| Yelin Samuel | $100,000 | -- | |
| Diaz Irenaida | $39,500 | -- | |
| Roque Estela C | $100 | -- | |
| Roque Estela C | $64,000 | -- |
Source: Public Records
Mortgage History
| Date | Status | Borrower | Loan Amount |
|---|---|---|---|
| Previous Owner | Roque Estela C | $57,600 |
Source: Public Records
Tax History
| Year | Tax Paid | Tax Assessment Tax Assessment Total Assessment is a certain percentage of the fair market value that is determined by local assessors to be the total taxable value of land and additions on the property. | Land | Improvement |
|---|---|---|---|---|
| 2025 | $10,901 | $477,517 | -- | -- |
| 2024 | $10,120 | $434,107 | -- | -- |
| 2023 | $10,120 | $394,643 | $0 | $0 |
| 2022 | $9,038 | $358,767 | $0 | $0 |
| 2021 | $7,590 | $326,152 | $0 | $0 |
| 2020 | $7,194 | $366,547 | $266,746 | $99,801 |
| 2019 | $6,930 | $380,937 | $280,785 | $100,152 |
| 2018 | $6,430 | $381,289 | $280,785 | $100,504 |
| 2017 | $6,210 | $222,768 | $0 | $0 |
| 2016 | $5,927 | $202,517 | $0 | $0 |
| 2015 | $4,776 | $184,107 | $0 | $0 |
| 2014 | $4,204 | $167,370 | $0 | $0 |
Source: Public Records
Map
Nearby Homes
- 260 NE 46th St
- 270 NE 46th St
- 260 NE 48th Terrace
- 201 NE 48th St
- 200 NE 48th Terrace
- 4727 NE 1st Ct
- 169 NE 48th St
- 137 NE 46th St
- 135 NE 45th St
- 231 NE 43rd St
- 133 NE 48th St
- 4250 Biscayne Blvd Unit 1618
- 4250 Biscayne Blvd Unit 1112
- 4250 Biscayne Blvd Unit 1211
- 4250 Biscayne Blvd Unit 1008
- 4250 Biscayne Blvd Unit 1104
- 4250 Biscayne Blvd Unit 1006
- 4250 Biscayne Blvd Unit 804
- 4250 Biscayne Blvd Unit 902
- 4250 Biscayne Blvd Unit 1516