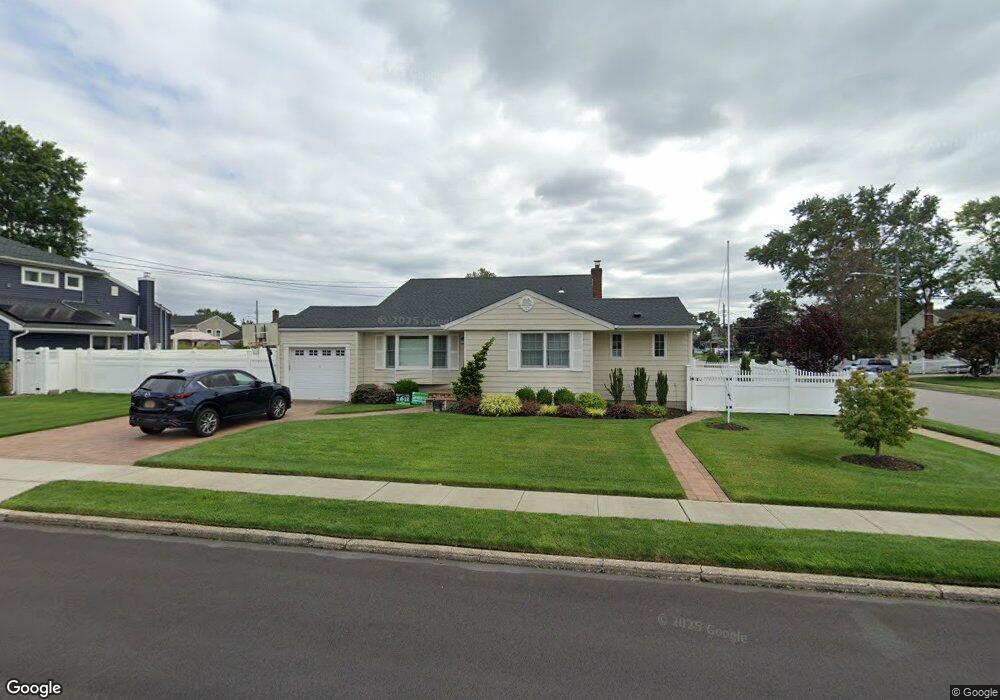
250 Rose St Massapequa Park, NY 11762
Estimated Value: $695,000 - $766,831
--
Bed
2
Baths
1,396
Sq Ft
$524/Sq Ft
Est. Value
About This Home
This home is located at 250 Rose St, Massapequa Park, NY 11762 and is currently estimated at $730,916, approximately $523 per square foot. 250 Rose St is a home located in Nassau County with nearby schools including Albany Avenue Elementary School, Weldon E. Howitt Middle School, and Farmingdale Senior High School.
Ownership History
Date
Name
Owned For
Owner Type
Purchase Details
Closed on
Jun 17, 2010
Sold by
Griffin Barbara and Camperiengo John
Bought by
Langkay Rigel and Guinoo Ana Lissa
Current Estimated Value
Home Financials for this Owner
Home Financials are based on the most recent Mortgage that was taken out on this home.
Original Mortgage
$324,000
Outstanding Balance
$217,252
Interest Rate
4.98%
Mortgage Type
Purchase Money Mortgage
Estimated Equity
$513,664
Purchase Details
Closed on
Nov 27, 2007
Sold by
Camperlengo Joseph
Create a Home Valuation Report for This Property
The Home Valuation Report is an in-depth analysis detailing your home's value as well as a comparison with similar homes in the area
Home Values in the Area
Average Home Value in this Area
Purchase History
| Date | Buyer | Sale Price | Title Company |
|---|---|---|---|
| Langkay Rigel | $405,000 | -- | |
| -- | -- | -- |
Source: Public Records
Mortgage History
| Date | Status | Borrower | Loan Amount |
|---|---|---|---|
| Open | Langkay Rigel | $324,000 |
Source: Public Records
Tax History Compared to Growth
Tax History
| Year | Tax Paid | Tax Assessment Tax Assessment Total Assessment is a certain percentage of the fair market value that is determined by local assessors to be the total taxable value of land and additions on the property. | Land | Improvement |
|---|---|---|---|---|
| 2025 | $11,545 | $429 | $189 | $240 |
| 2024 | $3,347 | $472 | $208 | $264 |
| 2023 | $13,328 | $481 | $212 | $269 |
| 2022 | $13,328 | $481 | $212 | $269 |
| 2021 | $13,803 | $463 | $204 | $259 |
| 2020 | $14,243 | $827 | $535 | $292 |
| 2019 | $14,597 | $827 | $535 | $292 |
| 2018 | $12,326 | $827 | $0 | $0 |
| 2017 | $7,706 | $827 | $535 | $292 |
| 2016 | $10,866 | $827 | $535 | $292 |
| 2015 | $2,792 | $827 | $535 | $292 |
| 2014 | $2,792 | $827 | $535 | $292 |
| 2013 | $2,613 | $827 | $535 | $292 |
Source: Public Records
Map
Nearby Homes