Estimated Value: $559,307 - $690,000
3
Beds
2
Baths
3,540
Sq Ft
$173/Sq Ft
Est. Value
About This Home
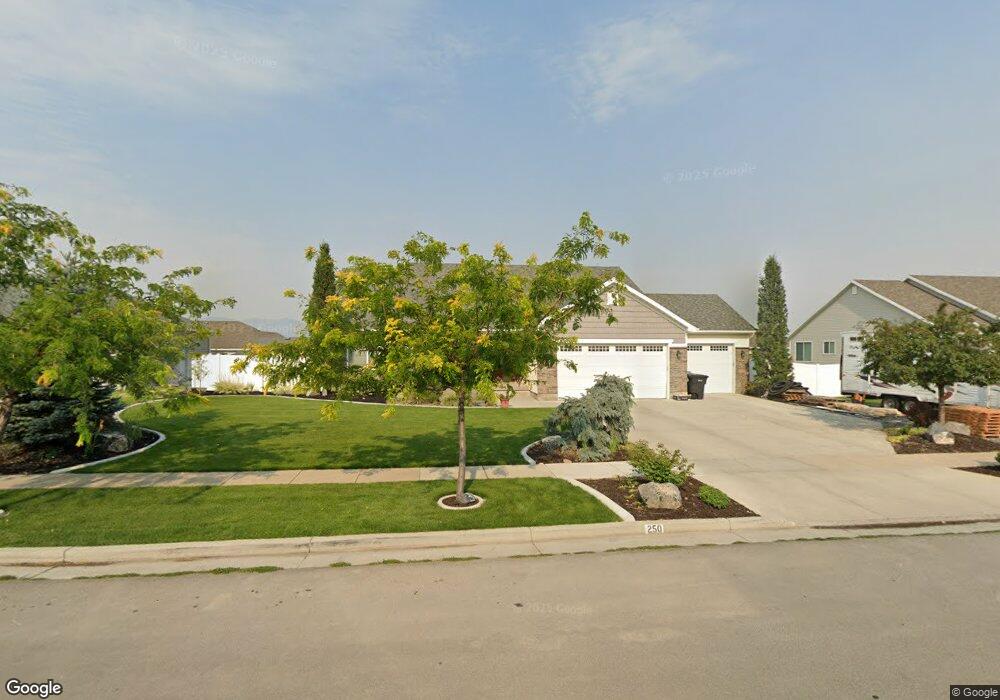
This home is located at 250 S 1130 E, Hyrum, UT 84319 and is currently estimated at $613,327, approximately $173 per square foot. 250 S 1130 E is a home located in Cache County with nearby schools including Canyon School, South Cache Middle School, and Mountain Crest High School.
Ownership History
Date
Name
Owned For
Owner Type
Purchase Details
Closed on
Sep 30, 2016
Sold by
Booth Tyson and Booth Stephanie
Bought by
Booth Tyson and Booth Stephanie
Current Estimated Value
Home Financials for this Owner
Home Financials are based on the most recent Mortgage that was taken out on this home.
Original Mortgage
$244,800
Outstanding Balance
$194,665
Interest Rate
3.46%
Mortgage Type
New Conventional
Estimated Equity
$418,662
Purchase Details
Closed on
Jun 4, 2014
Sold by
Continental Development Inc
Bought by
Booth Tyson and Booth Stephanie
Home Financials for this Owner
Home Financials are based on the most recent Mortgage that was taken out on this home.
Original Mortgage
$185,600
Interest Rate
4.25%
Mortgage Type
Future Advance Clause Open End Mortgage
Purchase Details
Closed on
May 21, 2013
Sold by
South Ridge Acres Llc
Bought by
Continental Development Inc
Purchase Details
Closed on
Jan 11, 2010
Sold by
South Ridge Acres Llc
Bought by
Continental Development Inc
Create a Home Valuation Report for This Property
The Home Valuation Report is an in-depth analysis detailing your home's value as well as a comparison with similar homes in the area
Home Values in the Area
Average Home Value in this Area
Purchase History
| Date | Buyer | Sale Price | Title Company |
|---|---|---|---|
| Booth Tyson | -- | Advanced Title | |
| Booth Tyson | -- | Cache Title | |
| Continental Development Inc | -- | Cache Title Logan | |
| Continental Development Inc | -- | Cache Title Company |
Source: Public Records
Mortgage History
| Date | Status | Borrower | Loan Amount |
|---|---|---|---|
| Open | Booth Tyson | $244,800 | |
| Previous Owner | Booth Tyson | $185,600 |
Source: Public Records
Tax History
| Year | Tax Paid | Tax Assessment Tax Assessment Total Assessment is a certain percentage of the fair market value that is determined by local assessors to be the total taxable value of land and additions on the property. | Land | Improvement |
|---|---|---|---|---|
| 2025 | $2,273 | $326,310 | $0 | $0 |
| 2024 | $2,420 | $324,425 | $0 | $0 |
| 2023 | $2,314 | $296,645 | $0 | $0 |
| 2022 | $2,415 | $296,645 | $0 | $0 |
| 2021 | $2,156 | $408,017 | $65,050 | $342,967 |
| 2020 | $2,045 | $363,283 | $65,050 | $298,233 |
| 2019 | $2,025 | $338,233 | $40,000 | $298,233 |
| 2018 | $1,896 | $306,280 | $40,000 | $266,280 |
| 2017 | $1,927 | $161,480 | $0 | $0 |
| 2016 | $1,970 | $135,850 | $0 | $0 |
| 2015 | $1,563 | $127,765 | $0 | $0 |
| 2014 | $478 | $40,000 | $0 | $0 |
| 2013 | -- | $40,000 | $0 | $0 |
Source: Public Records
Map
Nearby Homes
Your Personal Tour Guide
Ask me questions while you tour the home.