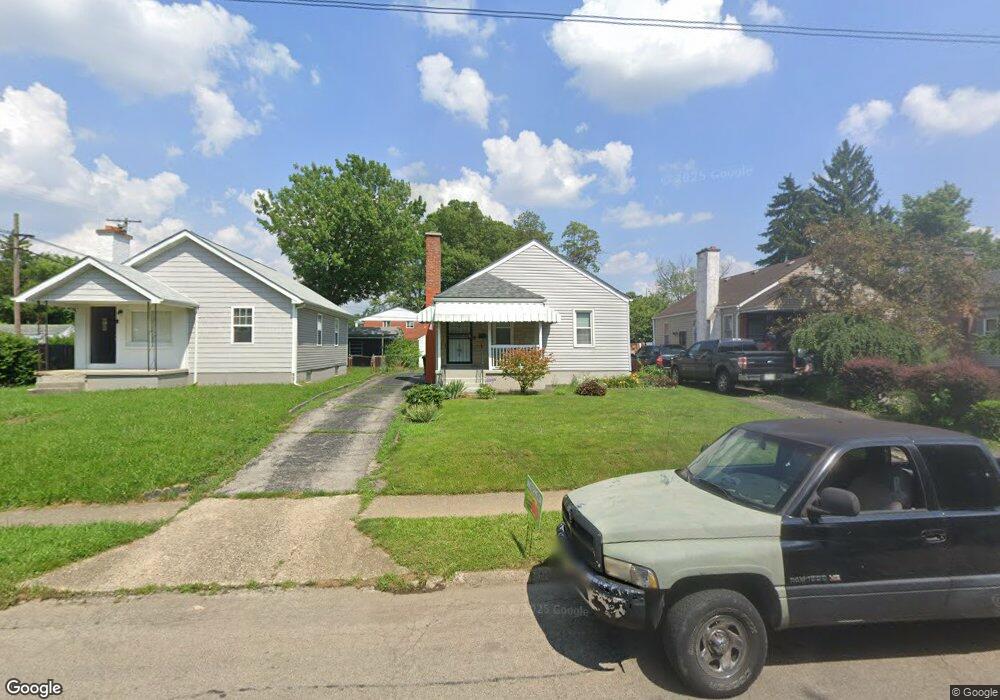
250 S Weyant Ave Columbus, OH 43213
Eastmoor NeighborhoodEstimated Value: $133,000 - $165,999
2
Beds
1
Bath
1,020
Sq Ft
$150/Sq Ft
Est. Value
About This Home
This home is located at 250 S Weyant Ave, Columbus, OH 43213 and is currently estimated at $152,500, approximately $149 per square foot. 250 S Weyant Ave is a home located in Franklin County with nearby schools including Fairmoor Elementary School, Johnson Park Middle School, and Walnut Ridge High School.
Ownership History
Date
Name
Owned For
Owner Type
Purchase Details
Closed on
Mar 22, 1999
Sold by
Reeder Jerry O
Bought by
Shvartsman Idel and Shvartsman Minnigul
Current Estimated Value
Home Financials for this Owner
Home Financials are based on the most recent Mortgage that was taken out on this home.
Original Mortgage
$61,989
Outstanding Balance
$15,131
Interest Rate
6.85%
Mortgage Type
FHA
Estimated Equity
$137,369
Purchase Details
Closed on
Oct 8, 1997
Sold by
Barton Smith Mary
Bought by
Reeder Jerry O
Home Financials for this Owner
Home Financials are based on the most recent Mortgage that was taken out on this home.
Original Mortgage
$55,998
Interest Rate
7.7%
Mortgage Type
VA
Purchase Details
Closed on
Nov 17, 1994
Sold by
Scrimsher Tracy P
Bought by
Mary Barton Smith
Home Financials for this Owner
Home Financials are based on the most recent Mortgage that was taken out on this home.
Original Mortgage
$48,900
Interest Rate
8.91%
Mortgage Type
New Conventional
Purchase Details
Closed on
Sep 1, 1988
Create a Home Valuation Report for This Property
The Home Valuation Report is an in-depth analysis detailing your home's value as well as a comparison with similar homes in the area
Home Values in the Area
Average Home Value in this Area
Purchase History
| Date | Buyer | Sale Price | Title Company |
|---|---|---|---|
| Shvartsman Idel | $62,500 | George Pritsollas Title | |
| Reeder Jerry O | $54,900 | -- | |
| Mary Barton Smith | $48,900 | -- | |
| -- | $44,900 | -- |
Source: Public Records
Mortgage History
| Date | Status | Borrower | Loan Amount |
|---|---|---|---|
| Open | Shvartsman Idel | $61,989 | |
| Closed | Reeder Jerry O | $55,998 | |
| Previous Owner | Mary Barton Smith | $48,900 |
Source: Public Records
Tax History Compared to Growth
Tax History
| Year | Tax Paid | Tax Assessment Tax Assessment Total Assessment is a certain percentage of the fair market value that is determined by local assessors to be the total taxable value of land and additions on the property. | Land | Improvement |
|---|---|---|---|---|
| 2024 | $2,269 | $50,550 | $11,800 | $38,750 |
| 2023 | $2,240 | $50,540 | $11,795 | $38,745 |
| 2022 | $1,674 | $32,270 | $5,320 | $26,950 |
| 2021 | $1,677 | $32,270 | $5,320 | $26,950 |
| 2020 | $1,679 | $32,270 | $5,320 | $26,950 |
| 2019 | $1,614 | $26,610 | $4,450 | $22,160 |
| 2018 | $1,498 | $26,610 | $4,450 | $22,160 |
| 2017 | $1,613 | $26,610 | $4,450 | $22,160 |
| 2016 | $1,526 | $23,040 | $3,960 | $19,080 |
| 2015 | $1,385 | $23,040 | $3,960 | $19,080 |
| 2014 | $1,389 | $23,040 | $3,960 | $19,080 |
| 2013 | $721 | $24,255 | $4,165 | $20,090 |
Source: Public Records
Map
Nearby Homes
- 201 S Weyant Ave
- 178 S Weyant Ave
- 91 Maplewood Ave
- 247 S James Rd
- 277 S James Rd
- 320 Collingwood Ave
- 3814 Elbern Ave
- 239 S Kellner Rd
- 430 S James Rd
- 46 N Everett Ave
- 526 Collingwood Ave
- 59 N Everett Ave
- 73 N Everett Ave
- 88-90 N Waverly St
- 647 S Napoleon Ave
- 94 N Hampton Rd
- 646 S Weyant Ave
- 3160 Fair Ave
- 622 S Ashburton Rd
- 708 S Waverly St
- 256 S Weyant Ave
- 244 S Weyant Ave
- 262 S Weyant Ave
- 266 S Weyant Ave
- 232 S Weyant Ave
- 251 S Napoleon Ave Unit 4
- 251 S Napoleon Ave
- 261 S Napoleon Ave
- 272 S Weyant Ave
- 267 S Napoleon Ave
- 228 S Weyant Ave
- 247 S Weyant Ave
- 271 S Napoleon Ave
- 253 S Weyant Ave
- 241 S Weyant Ave
- 239 S Napoleon Ave
- 278 S Weyant Ave
- 222 S Weyant Ave
- 263 S Weyant Ave
- 233 S Napoleon Ave